← All prebuilt solutions
Management Accounts & Reporting

Budget vs Actual Commentary Pack

Monthly management reporting: variances, commentary, forecast and a one-page board report

£20

Secure checkout. Your download link is sent as soon as payment clears.
Budget vs Actual Commentary Pack

Overview

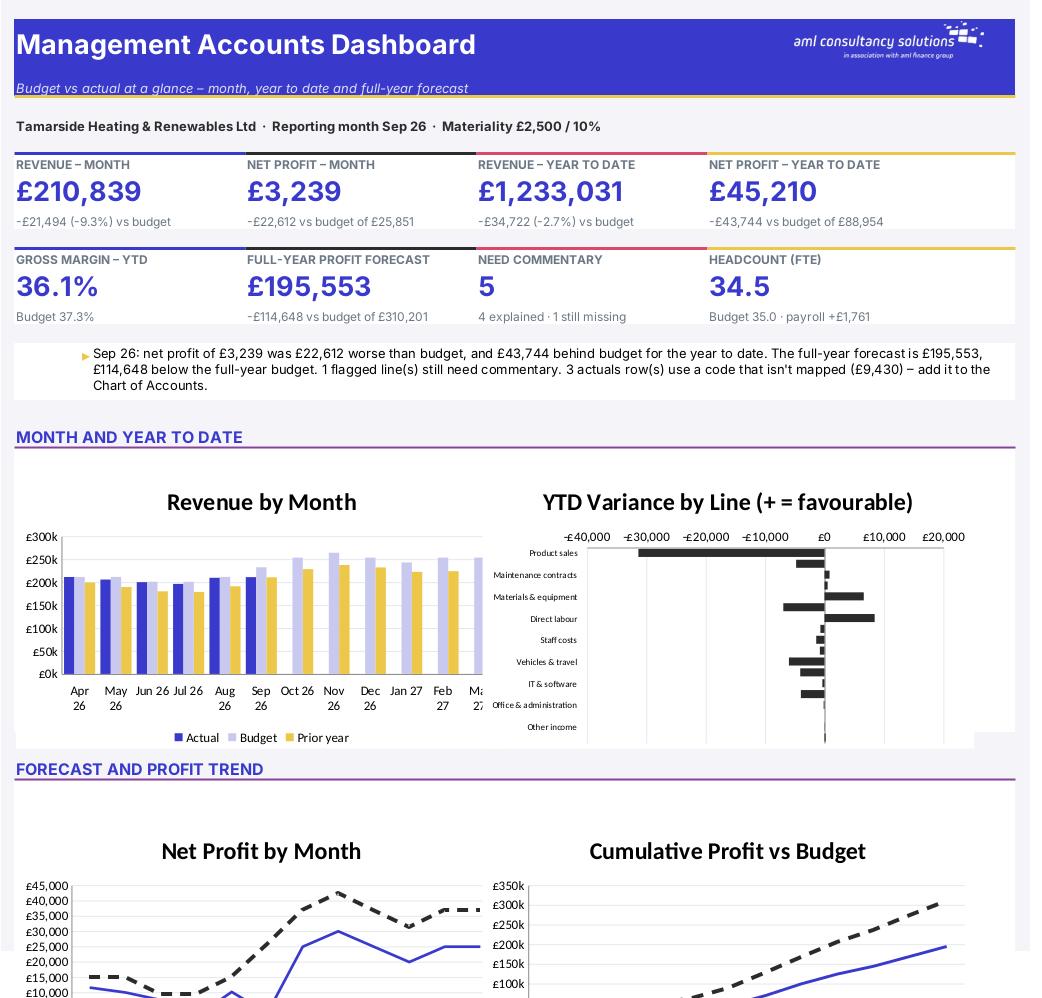
Every month, directors, lenders and investors ask the same questions: how did we do against budget, why, and where will the year end? This pack answers them. You map your accounting codes to the lines of your management accounts once, enter the budget and last year's figures, then each month paste the actuals from your accounting software. The workbook works out every variance for the month and the year to date, decides which ones are big enough to need an explanation, keeps a register of who is explaining what, writes summary sentences for the biggest variances, re-forecasts the full year and lays everything out on a one-page board report.

Price
£20
Who it’s for
Management Accounts & Reporting
Works with
Microsoft Excel for Windows and Mac
Buy now

See how it works

A walk through the main sheets

The sheets you will use most, in the order you will use them – shown with the sample data every workbook comes with.

Step 1

Board Report

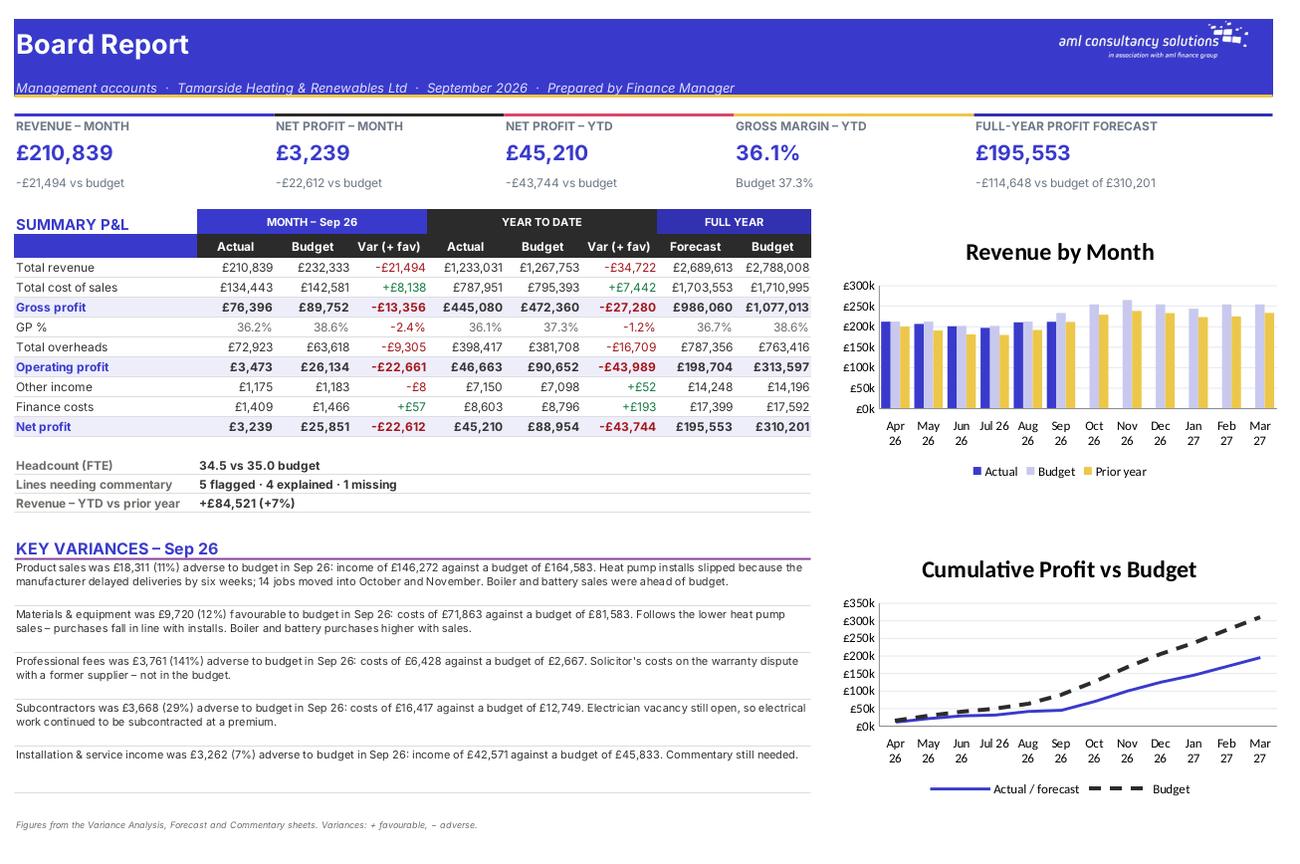
One-page A4 landscape summary for the board: KPIs, summary P&L, charts and the key variances. What you do: nothing – print it.
Board Report
Budget

Step 2

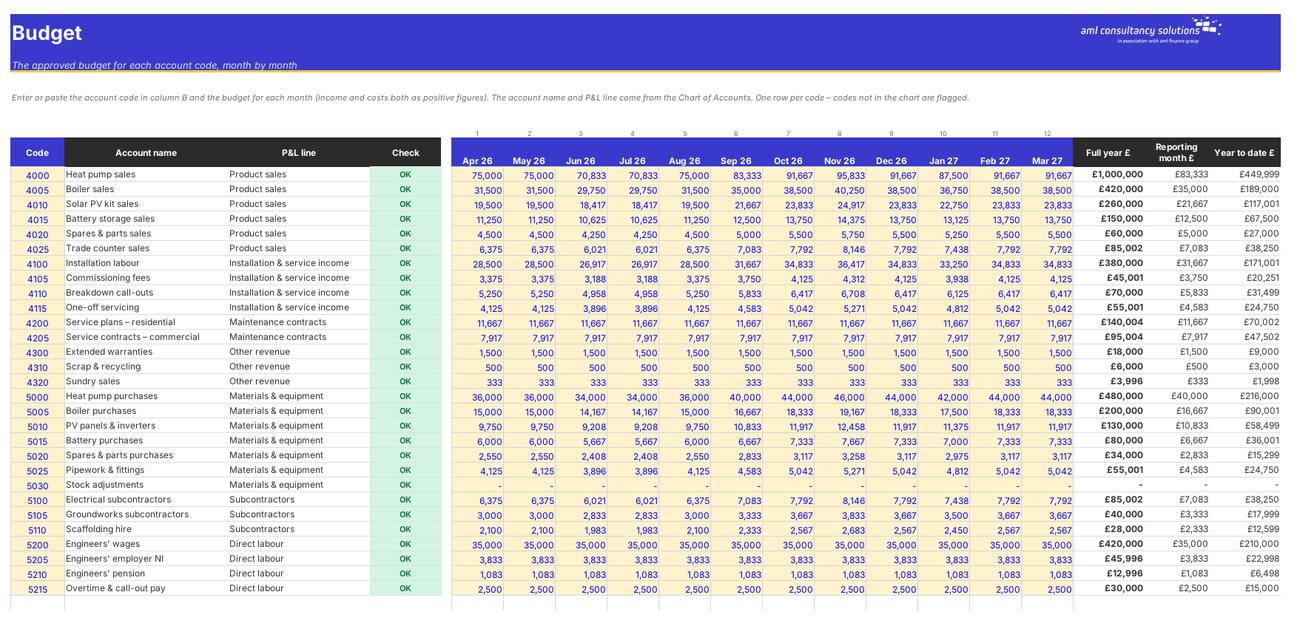
Budget

Budget by code by month. What you do: paste or type the budget once a year (and any re-approved budget).

Step 3

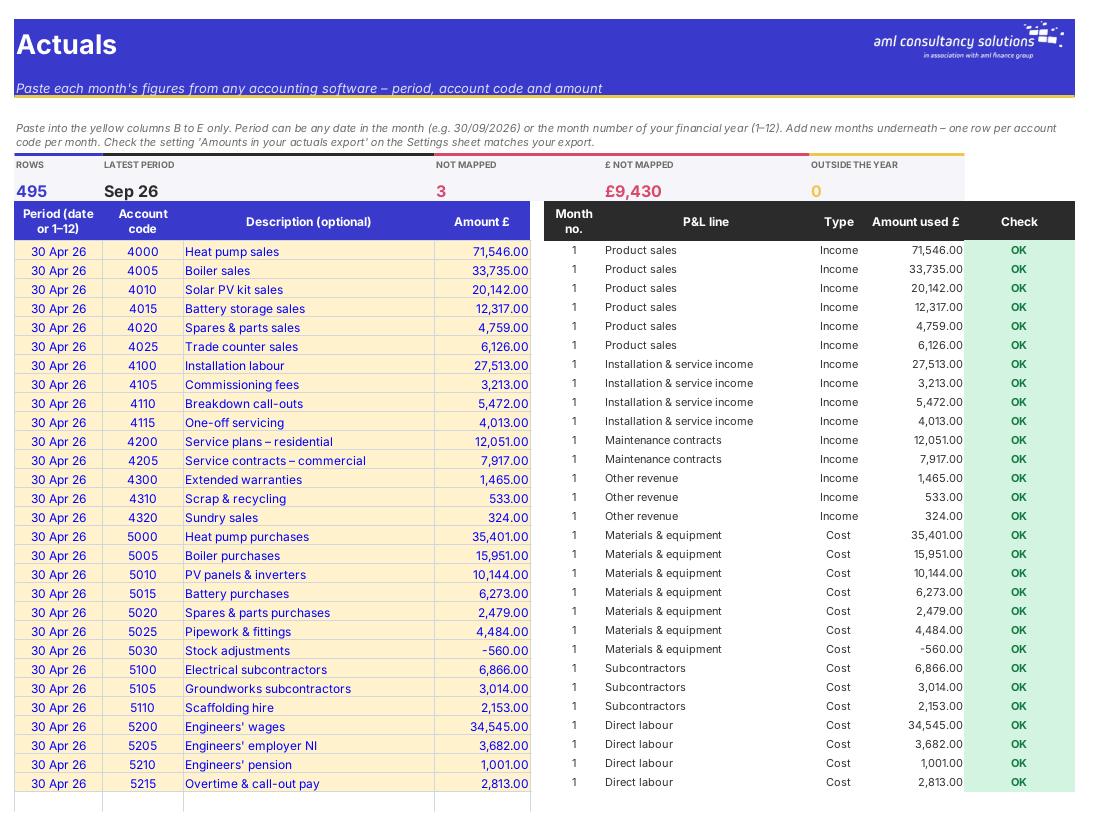
Actuals

Actual figures from your accounting software. What you do: paste each month's export underneath the last.
Actuals
Prior Year

Step 4

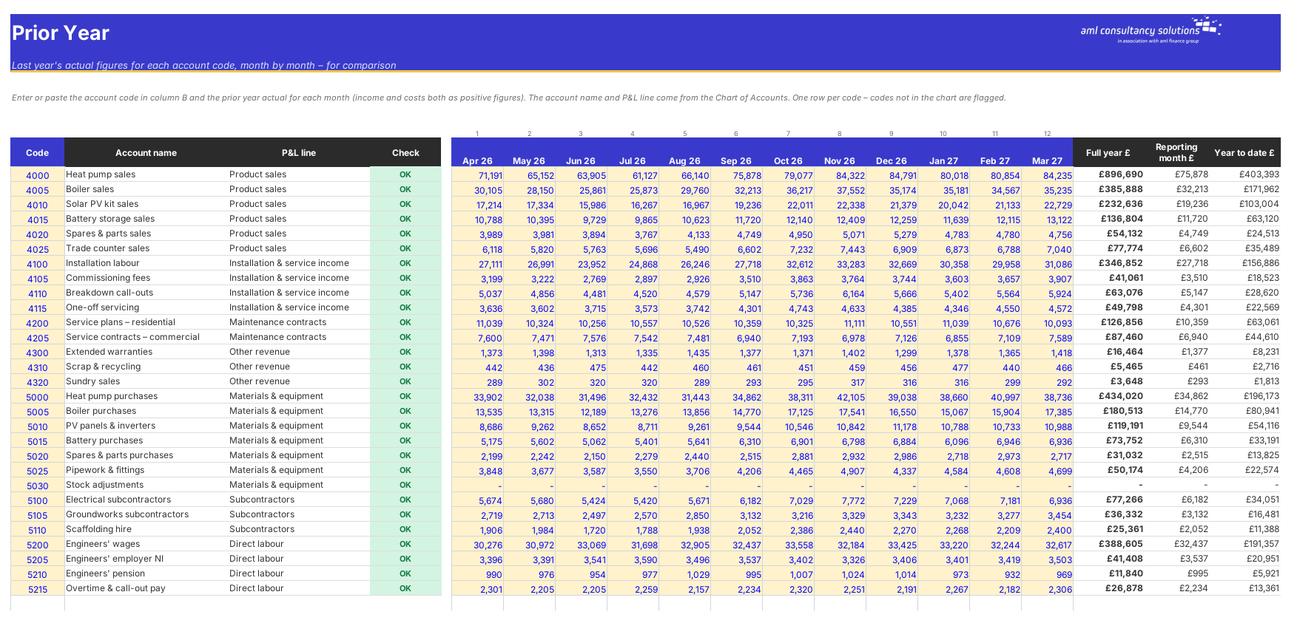
Prior Year

Last year's actuals by code by month. What you do: paste once a year.

Who it is for

Made for people like you

  • Example – text
  • Owner-managed SMEs – A proper monthly reporting pack without building one from scratch – P&L against budget and last year, with commentary.
  • Finance managers and FDs – A consistent month-end routine: paste actuals, review flags, collect commentary, print the board report.
  • Accountants and bookkeepers – A management accounts pack you can run for clients from any software that exports code and amount.
  • Boards, lenders and investors – A one-page A4 summary with KPIs, charts and plain-English explanations of the big variances.

Quick start

Up and running in minutes

  1. Example – text
  1. Settings – Enter the business name and the first month of your financial year. Check the P&L lines match the way you report – rename, add or remove lines and give each a section.
  2. Chart of Accounts – Paste your account codes and names, then pick the P&L line each code belongs to. Choose (Exclude) for balance sheet codes.
  3. Budget and Prior Year – Paste each code with its twelve monthly figures. Income and costs both as positive numbers.
  4. Actuals – Each month, export a P&L or nominal activity report by month with period, code and amount, and paste it underneath what's already there.
  5. Pick the reporting month – On Settings, choose the month you're reporting on. Everything up to and including it counts as year to date.
  6. Check the data – The Dashboard's DATA CHECKS should all say OK. Fix any unmapped codes or unrecognised periods first.
  7. Review the variances – On the Variance Analysis sheet, lines flagged 'Yes' need commentary. Ask each owner for an explanation.
  8. Write the commentary – On the Commentary sheet, add a row per flagged line: month, line, owner, explanation, action and due date.
  9. Re-forecast – On the Forecast sheet, switch any line you no longer believe the budget for to Manual and type the full-year figure you now expect.
  10. Print the board report – Check the Board Report sheet and print it (A4 landscape, one page) or save it as PDF.

Key features

  • Map up to 150 account codes to your P&L lines, enter the budget and prior year by month, and paste actuals from any accounting software (period, code and amount).
  • Month and year-to-date variances in £ and % with favourable / adverse logic for income and costs, materiality flags and a commentary register with owners, actions and due dates.
  • Auto-written summary sentences for the top 5 variances, a full-year re-forecast (actual plus budget remaining, or your own figure), price / volume / mix and headcount & payroll analysis.
  • One-page A4 landscape board report, a 12-month trend, account-level drill-down and a dashboard with data checks.

What’s included

  • Dashboard – Everything at a glance
  • Board Report – One-page A4 landscape summary
  • Settings – Reporting month, thresholds and P&L lines
  • Chart of Accounts – Map codes to P&L lines
  • Budget – Budget by code and month
  • Actuals – Paste actuals from your software
  • Prior Year – Last year by code and month
  • Commentary – Explanations, owners and actions
  • Price Volume Mix – Why revenue moved
  • Headcount & Payroll – FTE and payroll variances
  • Variance Analysis – Month and YTD variances with flags
  • Forecast – Full-year re-forecast
  • Trend – Twelve months at a glance
  • Account Detail – Drill down by account code
  • P&L by Month – Calculation engine
  • Guide – How to use this workbook

How buying works

Your file is only released once payment has cleared.

1

Click Buy now

You are taken to our secure checkout.

2

Pay securely

Checkout takes a minute and you get a receipt by email.

3

Download your file

Your download link arrives as soon as payment clears.

Explore the range

Need it tailored to your business?

We can adapt any prebuilt solution or build something bespoke, with a lifetime bug-free guarantee.

Part of AML Finance Group

Need an accountant too?

Our sister firm, AML Accountancy Solutions, is an award-winning accountancy practice helping businesses and individuals across the UK with their accounts, tax, bookkeeping and payroll.

Visit AML Accountancy Solutions