← All prebuilt solutions
Planning & Finance

Customer Profitability Analyser

Find out which customers really make you money – after every cost of serving them

£20

Secure checkout. Your download link is sent as soon as payment clears.

Customer Profitability Analyser

Overview

Most businesses know their sales and gross margin by customer – but not what it costs to serve each one. Small, frequent orders, heavy discounts, returns, rebates, slow payment, lots of sales visits and support calls can quietly turn a 'good' customer into a loss. This workbook takes your sales lines and a few facts about each customer, adds the direct costs of serving them and spreads your shared overheads by what actually drives them (activity-based costing). The result is a full profit and loss account for every customer, a whale curve, an 80/20 analysis, a profitability quadrant, segment and rep analysis, a price-leakage report and a list of customers losing money with a suggested action for each.

Price
£20
Who it’s for
Planning & Finance
Works with
Microsoft Excel for Windows and Mac
Buy now

See how it works

A walk through the main sheets

The sheets you will use most, in the order you will use them – shown with the sample data every workbook comes with.

Step 1

Sales Lines

Every invoice line for the period, with list price, off-list and discount leakage, net sales, cost and margin. What you do: paste your sales export.
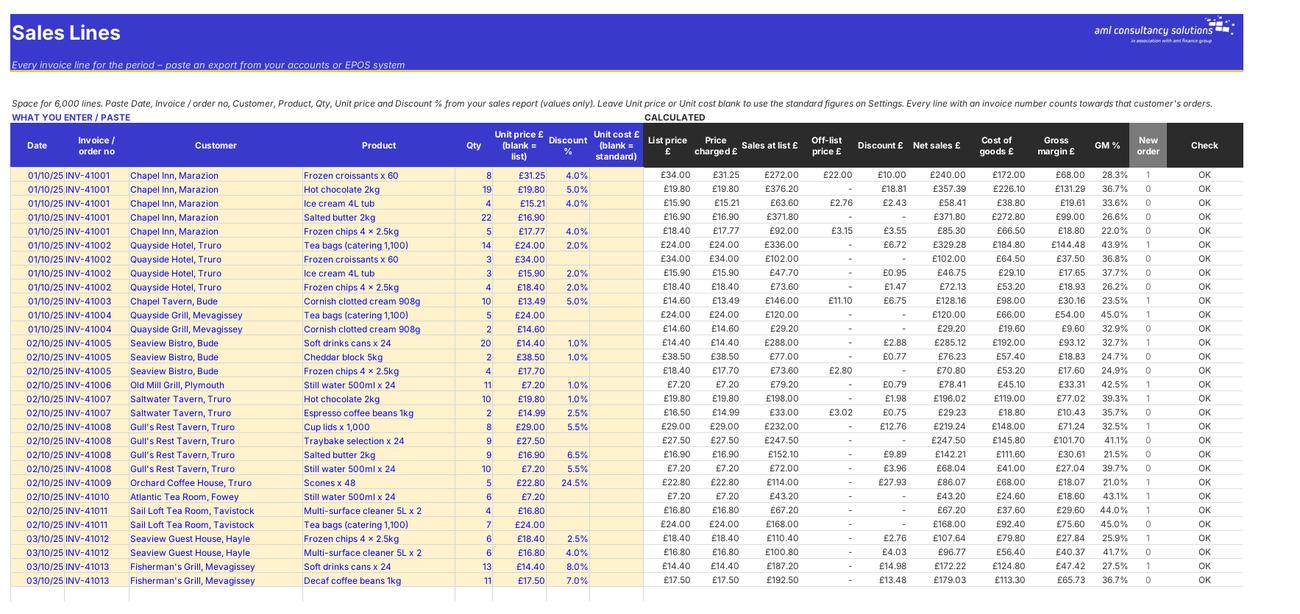
Sales Lines
Customer P&L

Step 2

Customer P&L

A full profit and loss for each customer, with status, quadrant, rank, biggest cost driver and suggested action. What you do: nothing to enter – filter and sort to explore.

Step 3

Whale Curve

Cumulative profit and revenue against customers ranked best to worst, key 80/20 findings and every customer ranked. What you do: nothing to enter.

Whale Curve
Quadrant

Step 4

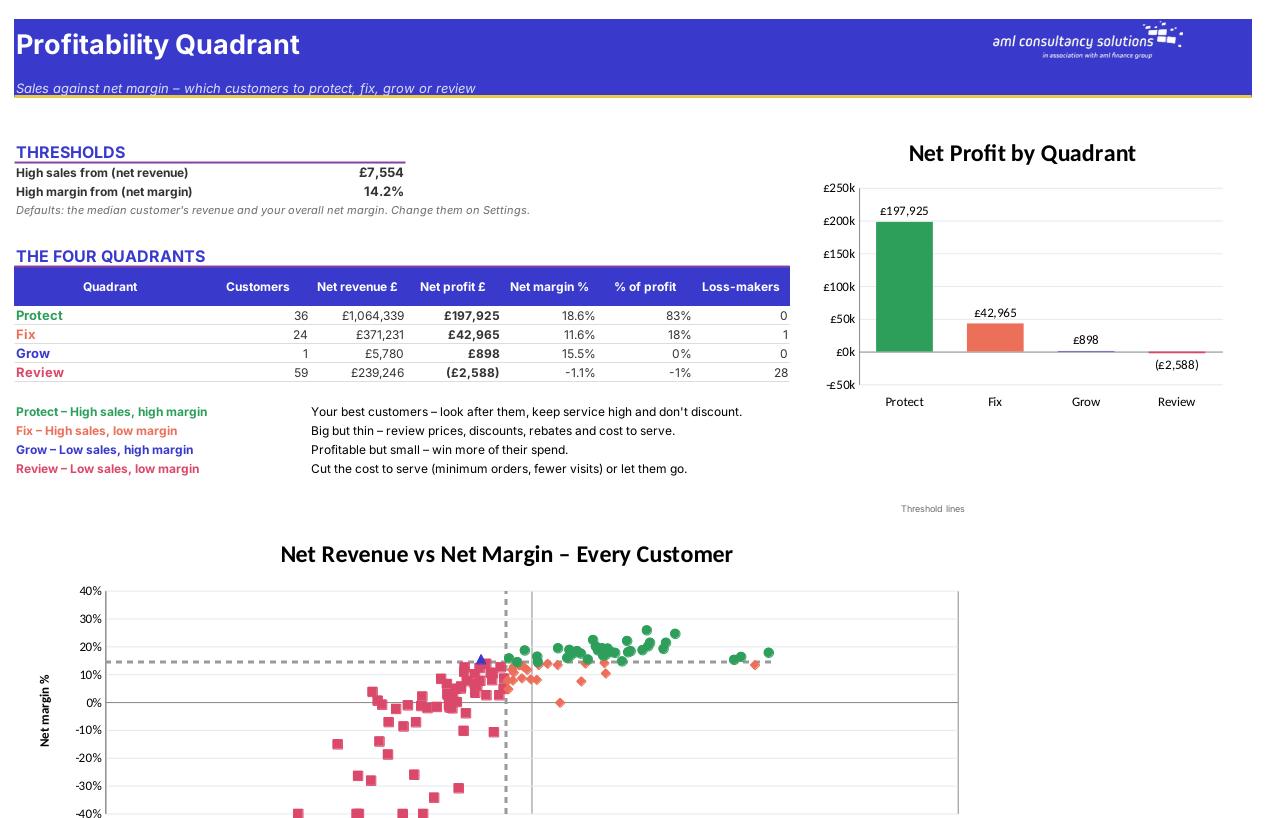
Quadrant

Every customer plotted by sales and net margin, and the four groups: Protect, Fix, Grow and Review. What you do: optionally change the thresholds on Settings.

Who it is for

Made for people like you

  • Example – text
  • Manufacturers and trade suppliers – Which customers and segments deserve price rises, minimum orders or a different service level.
  • Service and subscription businesses – Support-heavy and visit-heavy customers exposed.
  • Sales managers and directors – Rep and segment profitability, discount discipline and where to focus.

Quick start

Up and running in minutes

  1. Example – text
  1. Settings – rates – Enter your business name, the period your data covers, your cost of capital and what one delivery, one return, one sales visit and one support ticket cost you, plus your card fee %.
  2. Settings – overhead pools – List the shared costs you want to spread (order desk, warehouse, van fleet, admin, marketing…), their annual cost for the period and the cost driver for each.
  3. Settings – products and lists – Add your products with standard list price and unit cost, and your segments, regions and sales reps.
  4. Customers – One row per customer: segment, region, rep, payment terms, average days to pay, deliveries, returns, rebate %, visits, support tickets and % paid by card.
  5. Sales Lines – Paste every invoice line for the same period: date, invoice / order number, customer, product, quantity, unit price and discount %.
  6. Fix the checks – Clear any non-OK messages in the Check columns on Customers and Sales Lines.
  7. Read the results – Start with the Dashboard, then Loss-Makers, Whale Curve and Quadrant. Use Customer P&L for the detail behind any customer.

Key features

  • Customer list for up to 200 customers and 6,000 sales lines – paste straight from your accounts or EPOS sales report.
  • Revenue, discounts, returns, rebates and gross margin for every customer, then the true cost to serve: deliveries, returns, visits, support, card fees and the cost of slow payment.
  • Activity-based costing spreads your shared overheads by what drives them – orders, lines, deliveries, returns or revenue – with drivers you can change.
  • Whale curve, 80/20 analysis, profitability quadrant, segment and rep analysis, price leakage and a list of loss-making customers with suggested actions.

What’s included

  • Dashboard – Profit, cost to serve and loss-makers at a glance
  • Settings – Cost rates, overhead pools, products and lists
  • Customers – Customer details and costs to serve
  • Sales Lines – Every invoice line for the period
  • Customer P&L – Full profit and loss for every customer
  • Whale Curve – Cumulative profit and the 80/20 rule
  • Quadrant – Sales vs margin – protect, fix, grow or review
  • Segments & Reps – Profit by segment, region and rep
  • Price Leakage – Discounts and special prices
  • Loss-Makers – Customers losing money and what to do
  • Guide – How to use this workbook

How buying works

Your file is only released once payment has cleared.

1

Click Buy now

You are taken to our secure checkout.

2

Pay securely

Checkout takes a minute and you get a receipt by email.

3

Download your file

Your download link arrives as soon as payment clears.

Explore the range

Need it tailored to your business?

We can adapt any prebuilt solution or build something bespoke, with a lifetime bug-free guarantee.

Part of AML Finance Group

Need an accountant too?

Our sister firm, AML Accountancy Solutions, is an award-winning accountancy practice helping businesses and individuals across the UK with their accounts, tax, bookkeeping and payroll.

Visit AML Accountancy Solutions