← All prebuilt solutions
Industry

Farm Gross Margin Calculator

Know what every enterprise really earns – and what your prices need to be

£20

Secure checkout. Your download link is sent as soon as payment clears.
Farm Gross Margin Calculator

Overview

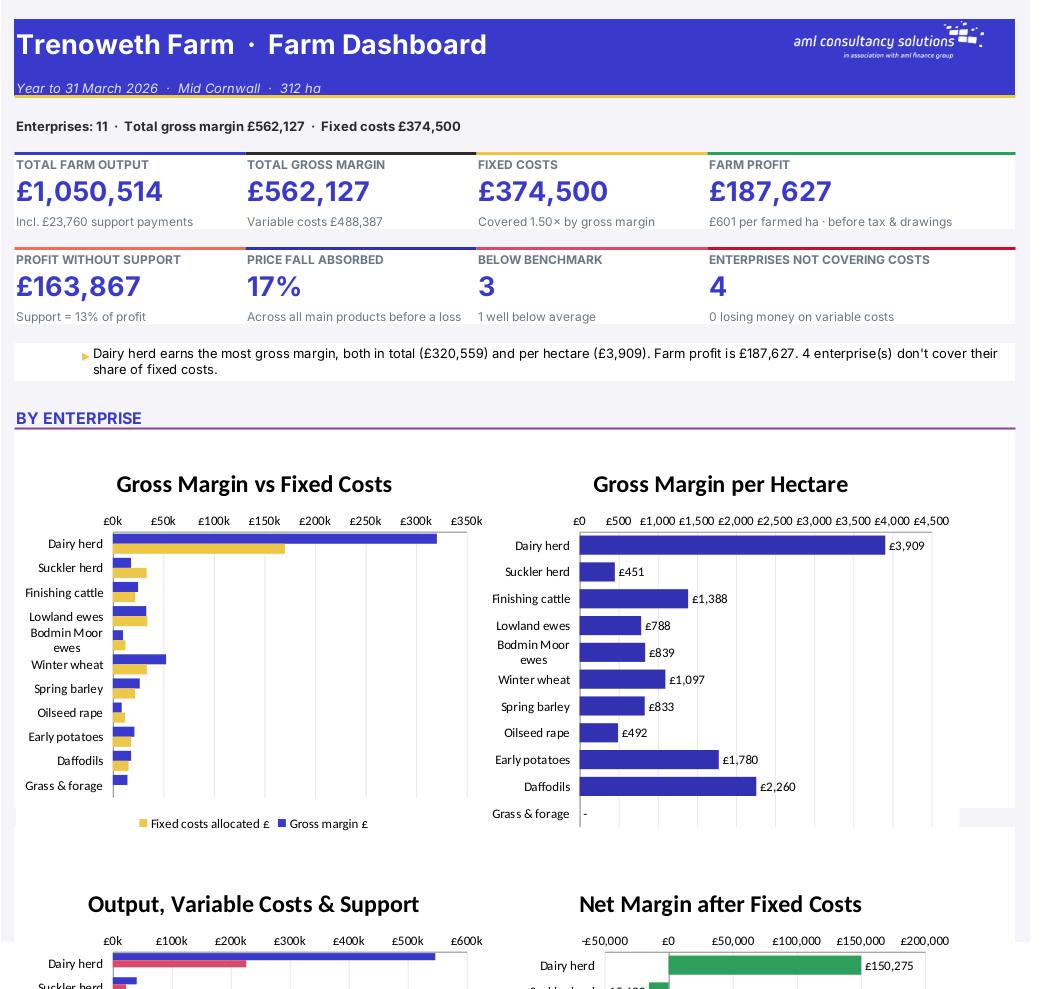
Gross margin – output less the variable costs that go with it – is the standard way farmers, advisers and banks compare enterprises. This workbook works out the gross margin for up to 12 enterprises, per head, per hectare and (for dairy) per litre, keeps scheme payments such as the Sustainable Farming Incentive on a separate line, charges grass and forage costs to the livestock that use them, and then shares out your fixed costs to show a net margin and break-even prices. It compares each enterprise with industry benchmarks you enter, tests what a 10% swing in prices or yields would do, and estimates the tax saved by farmers' averaging.

Price
£20
Who it’s for
Industry
Works with
Microsoft Excel for Windows and Mac
Buy now

See how it works

A walk through the main sheets

The sheets you will use most, in the order you will use them – shown with the sample data every workbook comes with.

Step 1

Enterprises

The gross margin for each enterprise, after-fixed-cost net margin and break-even prices. What you do: fill in a column per enterprise.

Enterprises
Fixed Costs

Step 2

Fixed Costs

Overheads and how they are shared between enterprises. What you do: list costs, pick a basis, set manual %.

Step 3

Whole Farm

Whole-farm profit, key ratios and an enterprise summary with break-even prices. What you do: enter other farm income.

Whole Farm
Benchmarking

Step 4

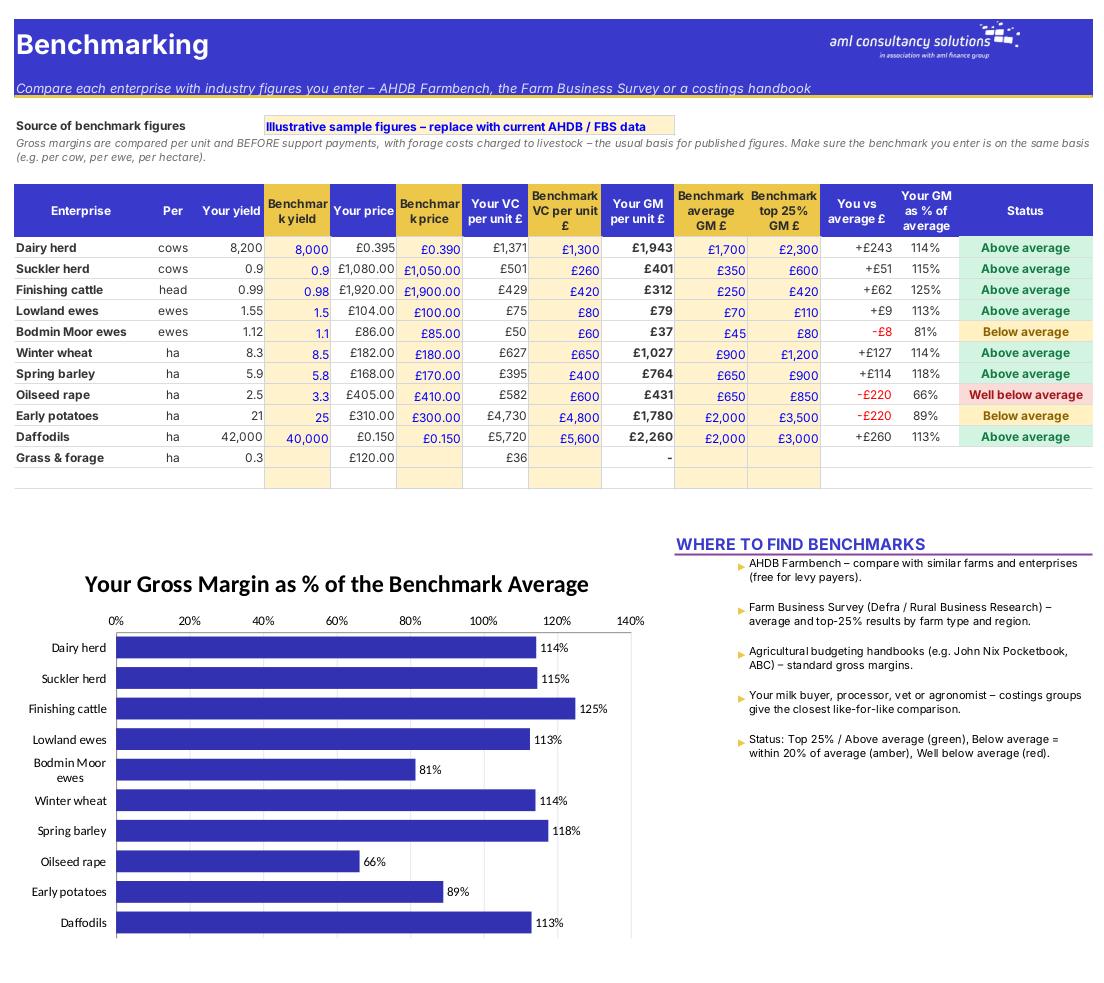
Benchmarking

Your yield, price, variable costs and gross margin against benchmark figures. What you do: enter benchmark figures.

Who it is for

Made for people like you

  • Example – text
  • Mixed and livestock farms – Dairy, suckler, finishing beef and sheep margins per head, per forage hectare and per litre.
  • Arable and horticulture – Cereals, oilseed rape, potatoes and daffodils per hectare, with break-even prices per tonne or per bunch.
  • Advisers, accountants and lenders – A clear whole-farm profit, fixed cost cover, sensitivity and benchmarking for budgets and bank meetings.

Quick start

Up and running in minutes

  1. Example – text
  1. Settings – Enter the farm name, location, the year the figures cover and your total farmed hectares. Decide whether forage costs are charged to livestock (normally Yes), set the sensitivity step and pick the tax year for the averaging calculator.
  2. Enterprises – One column per enterprise: name, type, size (head or hectares) and, for livestock, the forage hectares it uses. Then enter output and variable costs PER UNIT – per cow, per ewe, per head or per hectare – and any scheme payments as a TOTAL for that enterprise.
  3. Fixed Costs – List your overheads for the year – labour, machinery, property, admin and finance – and choose how each is shared. Set the Manual % row for anything best shared by labour time.
  4. Whole Farm – Add income that doesn't belong to an enterprise: delinked payment, other scheme payments, contracting and other farm income.
  5. Benchmarking – Enter yield, price, variable cost and gross margin figures from AHDB Farmbench, the Farm Business Survey or a costings handbook.
  6. Read the results – Check the Dashboard, the break-even prices on Whole Farm, the Sensitivity grid and – if your profits swing – the Averaging sheet.

Key features

  • Gross margins for up to 12 enterprises – dairy, suckler and finishing beef, lowland and upland sheep, cereals, oilseed rape, potatoes, daffodils and grass – per head, per hectare and per litre.
  • Scheme payments (SFI and others) kept on a separate line, so you can see each enterprise with and without support.
  • Forage costs charged to livestock, fixed costs shared out by area, output, gross margin or your own %, and whole-farm profit with break-even prices.
  • Benchmarking against AHDB / Farm Business Survey figures you enter, price and yield sensitivity, and a farmers' averaging tax calculator.

What’s included

  • Dashboard – The farm at a glance
  • Settings – Farm details and enterprise types
  • Enterprises – Gross margin for each enterprise
  • Fixed Costs – Overheads and how they're shared
  • Whole Farm – Profit and break-even prices
  • Benchmarking – Compare with industry figures
  • Sensitivity – Price and yield ± changes
  • Averaging – Farmers' averaging for income tax
  • Tax Rates – UK rates used
  • Guide – How to use this workbook

How buying works

Your file is only released once payment has cleared.

1

Click Buy now

You are taken to our secure checkout.

2

Pay securely

Checkout takes a minute and you get a receipt by email.

3

Download your file

Your download link arrives as soon as payment clears.

Explore the range

Need it tailored to your business?

We can adapt any prebuilt solution or build something bespoke, with a lifetime bug-free guarantee.

Part of AML Finance Group

Need an accountant too?

Our sister firm, AML Accountancy Solutions, is an award-winning accountancy practice helping businesses and individuals across the UK with their accounts, tax, bookkeeping and payroll.

Visit AML Accountancy Solutions