NPV, IRR, payback and sensitivity for up to three projects – and which to choose
Secure checkout. Your download link is sent as soon as payment clears.

Before you spend serious money on a new machine, a shop, a vehicle fleet or an energy project, you need to know whether it will earn more than the money costs you – and how sure you can be. This workbook turns your forecasts into year-by-year cash flows after tax, works out every standard investment measure, shows how far your forecasts could be wrong before the project stops paying, and compares up to three projects side by side.
See how it works
The sheets you will use most, in the order you will use them – shown with the sample data every workbook comes with.
Step 1
Inputs for up to three projects. What you do: enter each project's figures.

Step 2
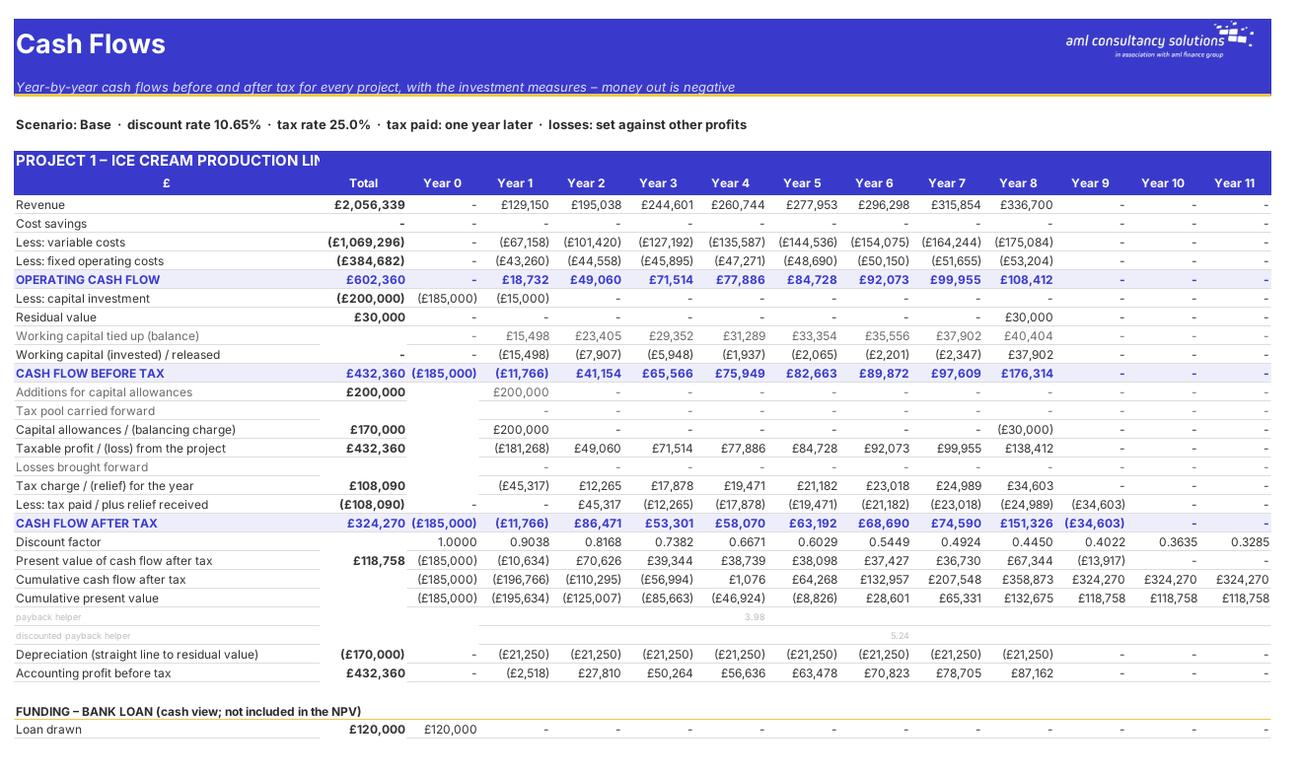
Year-by-year cash flows before and after tax, capital allowances, funding and all the measures for each project. What you do: nothing – check the workings.
Step 3
The three projects side by side, ranked, plus the NPV profile table and chart data. What you do: optionally change the yellow discount rates in the NPV profile.

Step 4
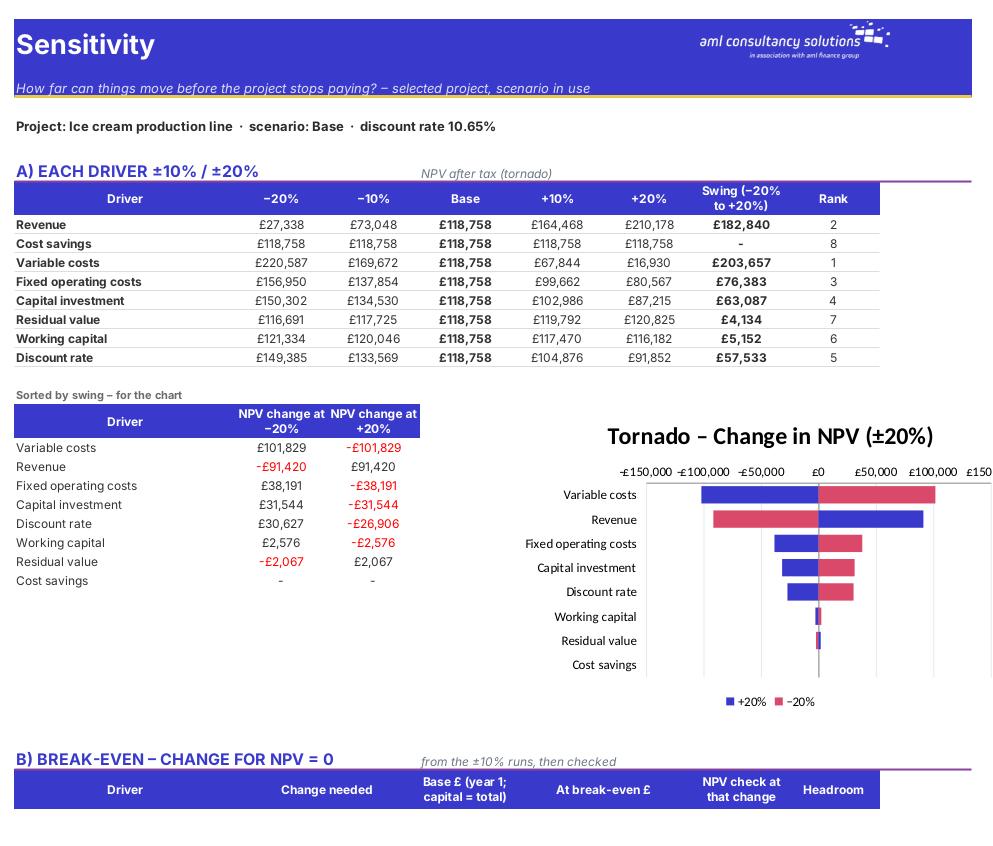
Tornado table and chart, break-even changes, discount rate × growth table and scenario results for the selected project. What you do: optionally change the two step sizes.
Who it is for
Quick start
Your file is only released once payment has cleared.
You are taken to our secure checkout.
Checkout takes a minute and you get a receipt by email.
Your download link arrives as soon as payment clears.
We can adapt any prebuilt solution or build something bespoke, with a lifetime bug-free guarantee.
Part of AML Finance Group
Our sister firm, AML Accountancy Solutions, is an award-winning accountancy practice helping businesses and individuals across the UK with their accounts, tax, bookkeeping and payroll.
Visit AML Accountancy Solutions