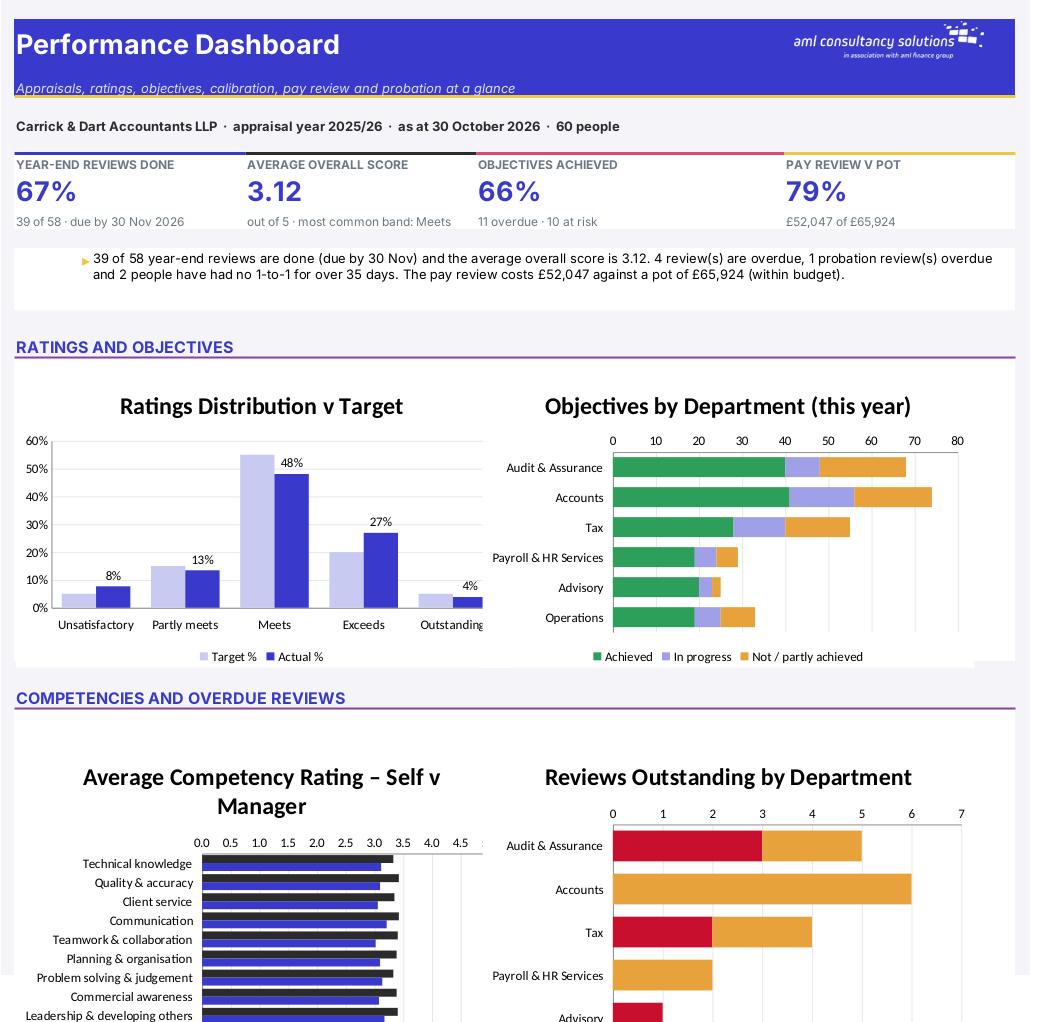
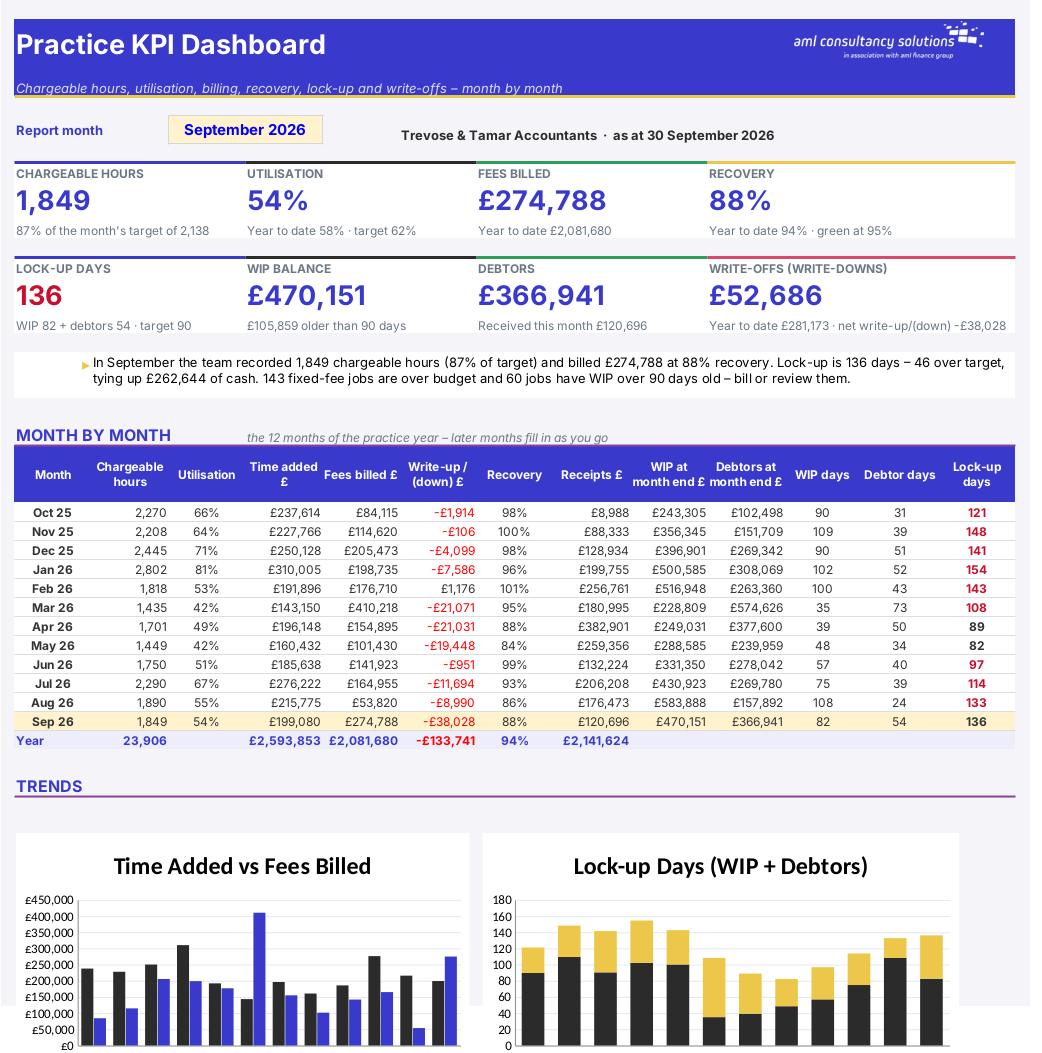
A monthly scorecard of up to 30 KPIs – red, amber, green, trends and a one-page board report
Secure checkout. Your download link is sent as soon as payment clears.
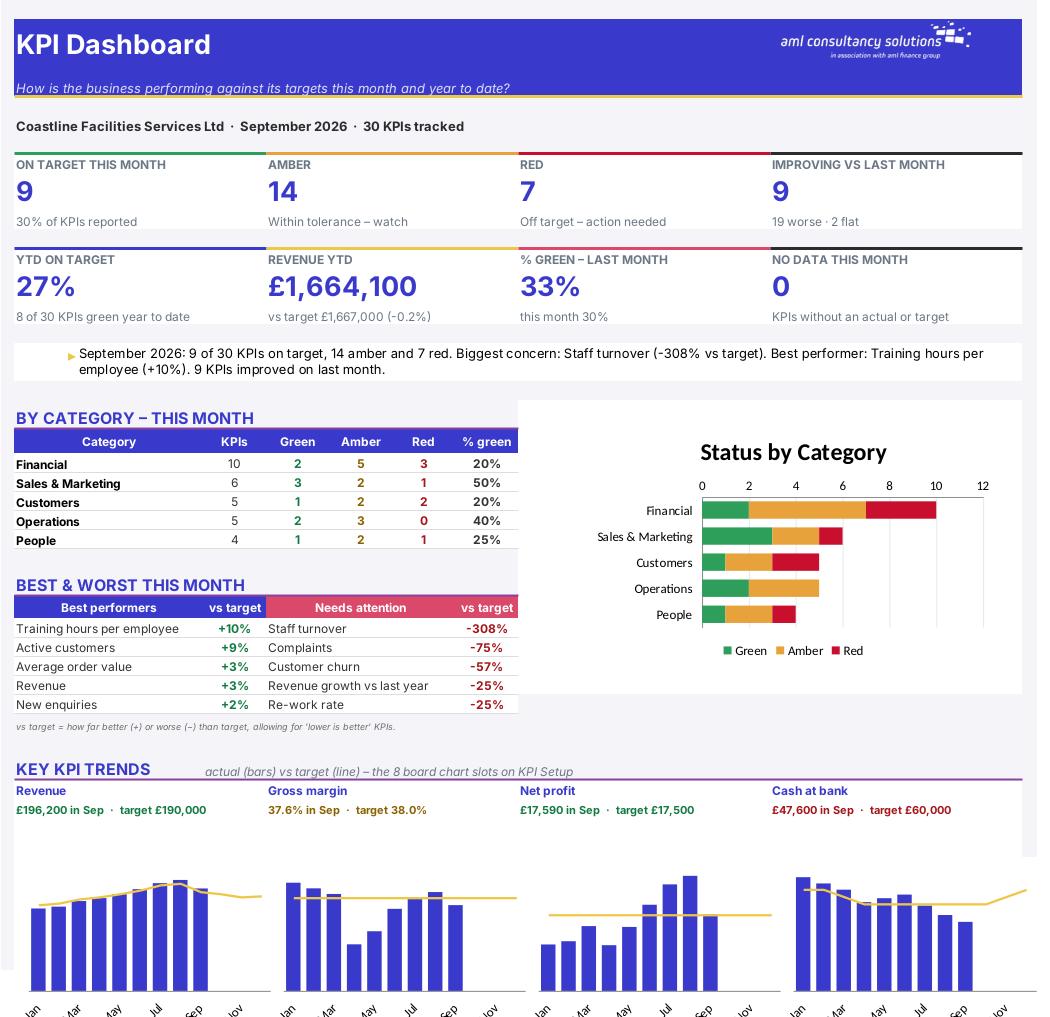
Key performance indicators (KPIs) are the handful of numbers that tell you whether the business is on track – not just profit, but the sales pipeline, customers, operations and people that drive it. This workbook lets you define up to 30 KPIs, set a target and a tolerance for each, and then every month shows which are on target (green), slightly off (amber) or seriously off (red), whether each is getting better or worse, and how the year is going. It produces a one-page board scorecard, a dashboard with mini trend charts and a 12-month heatmap, with space for the owner of each KPI to explain the number.
See how it works
The sheets you will use most, in the order you will use them – shown with the sample data every workbook comes with.
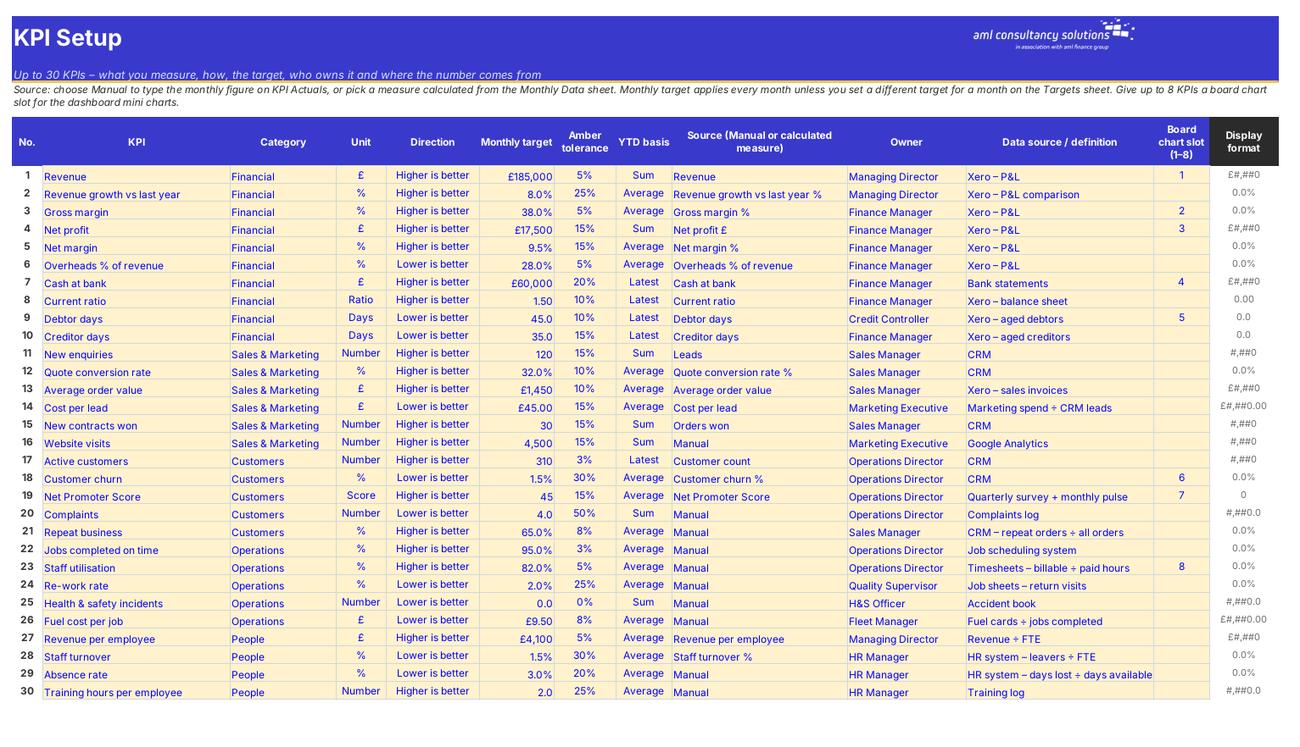
Step 1
The definition of every KPI. What you do: set up once; review each year.
Step 2
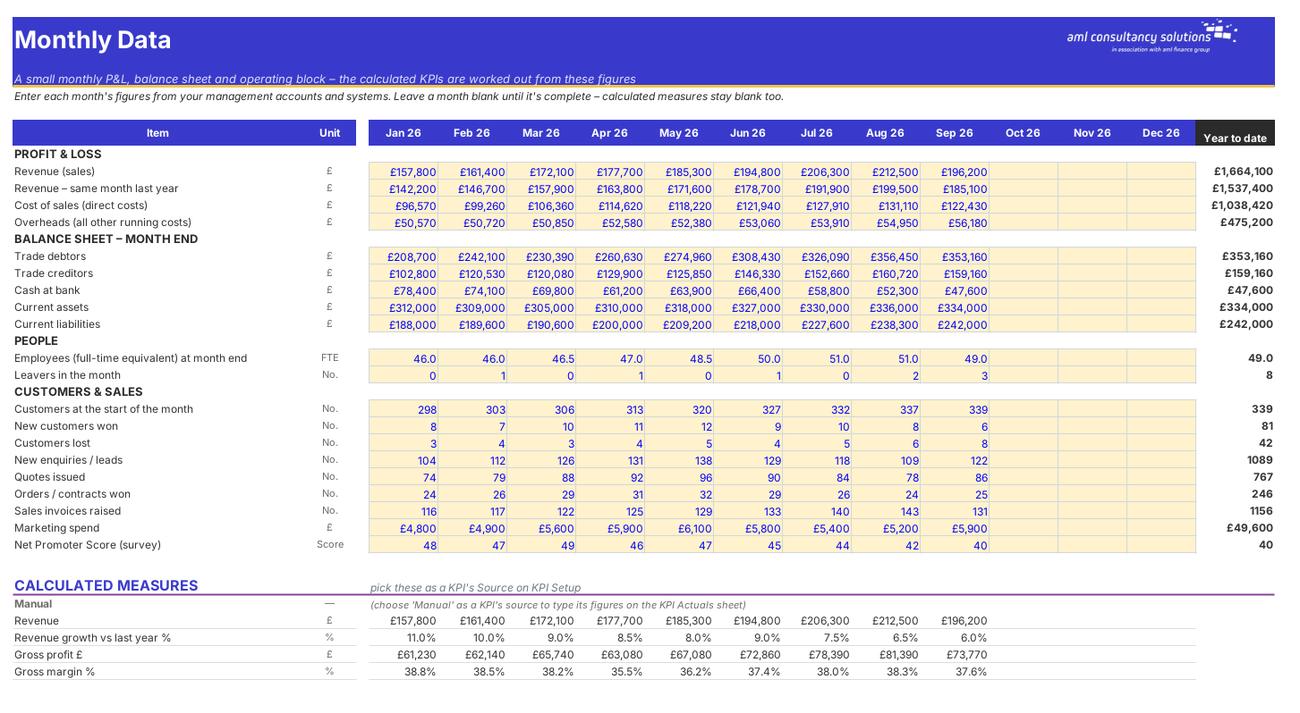
A small P&L, balance sheet, people, customer and sales block, plus the 22 calculated measures. What you do: enter each month's figures.
Step 3
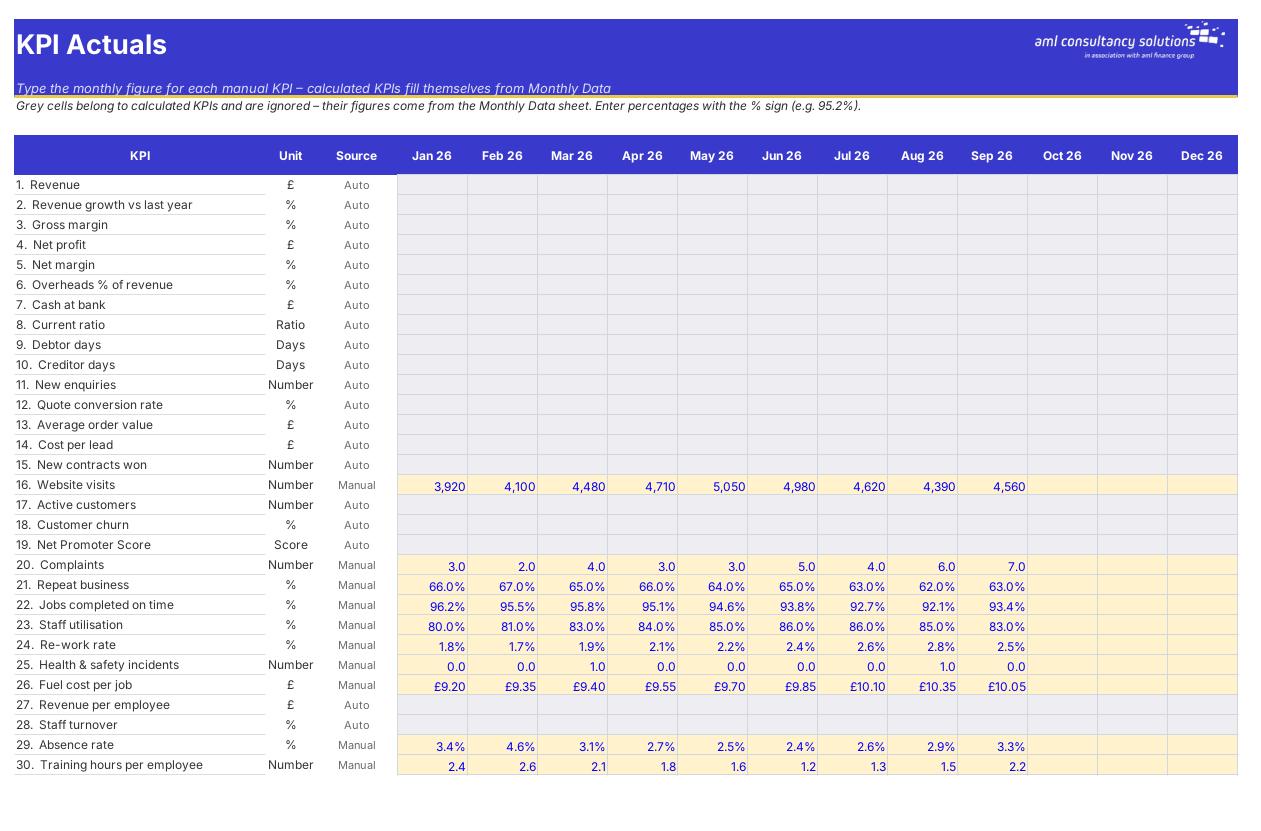
Monthly figures for manual KPIs. What you do: enter each month's figures.
Step 4
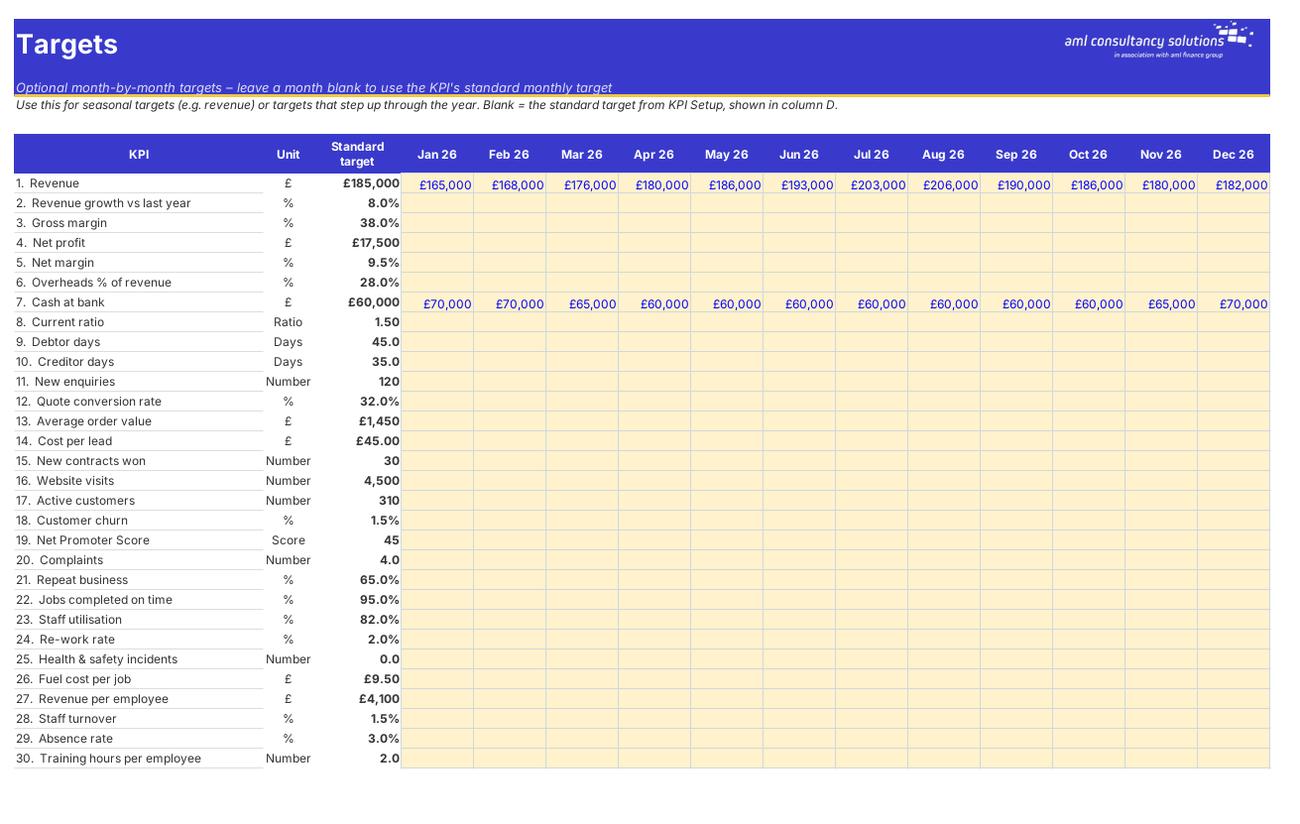
Optional month-by-month targets. What you do: only where a target varies by month.
Who it is for
Quick start
Your file is only released once payment has cleared.
You are taken to our secure checkout.
Checkout takes a minute and you get a receipt by email.
Your download link arrives as soon as payment clears.
We can adapt any prebuilt solution or build something bespoke, with a lifetime bug-free guarantee.
Part of AML Finance Group
Our sister firm, AML Accountancy Solutions, is an award-winning accountancy practice helping businesses and individuals across the UK with their accounts, tax, bookkeeping and payroll.
Visit AML Accountancy Solutions