← All prebuilt solutions
Management Accounts & Reporting

QuickBooks Dashboard – Lite

Turn your QuickBooks data into an interactive dashboard and ratio report

£5

Secure checkout. Your download link is sent as soon as payment clears.
QuickBooks Dashboard – Lite

Overview

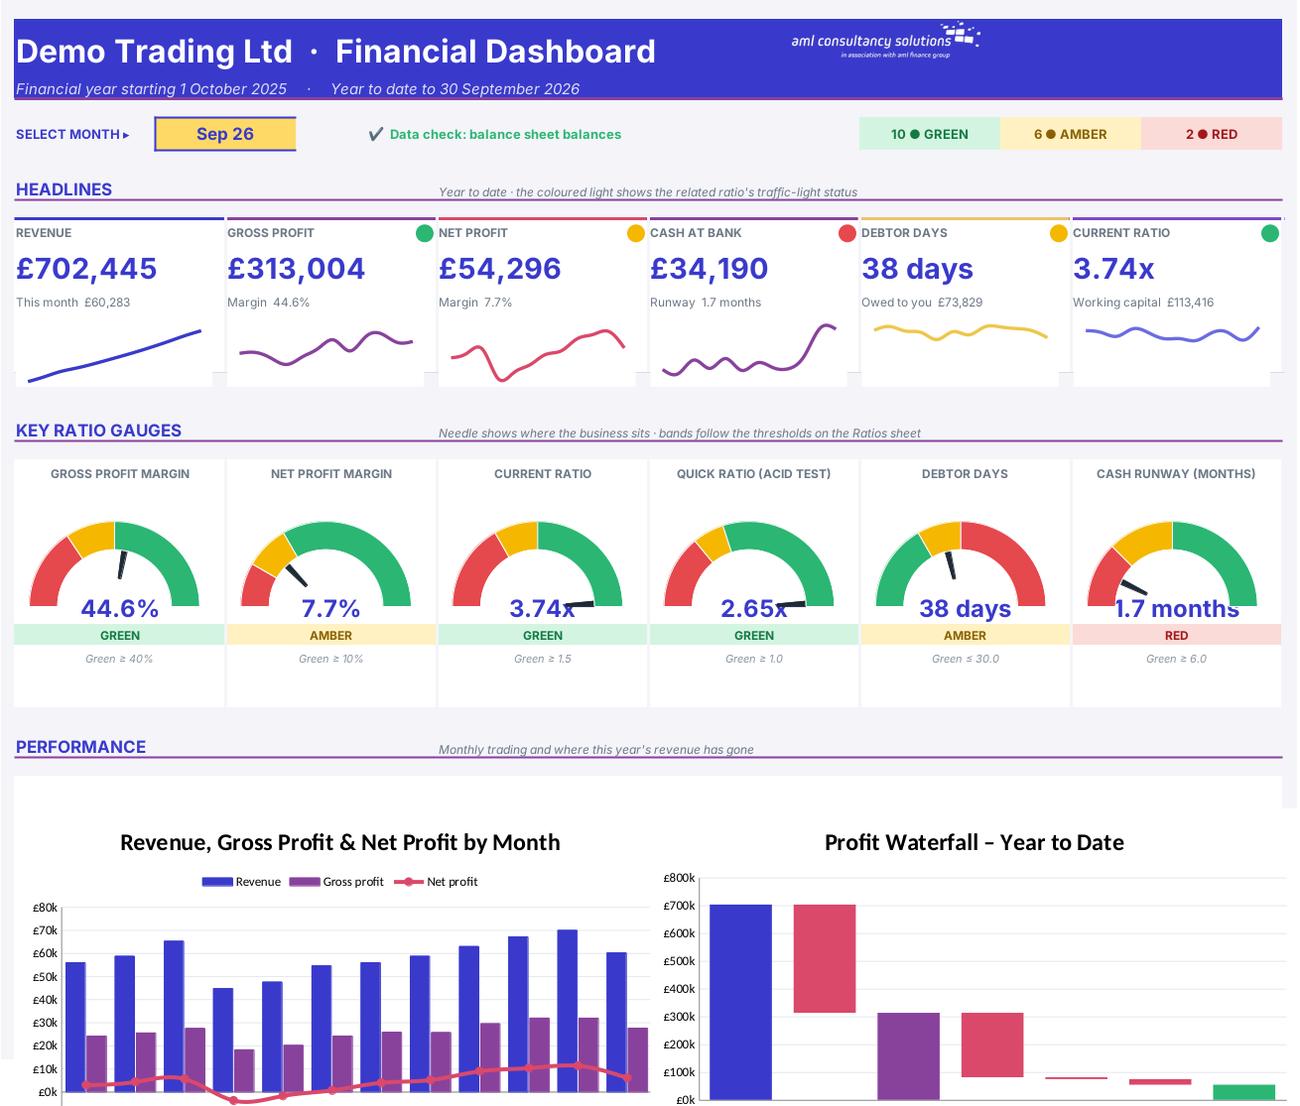
The QuickBooks Dashboard – Lite turns a straight copy of your QuickBooks chart of accounts and transactions into a one-page visual dashboard and an 18-ratio financial health check. Pick a month and you'll see revenue, profit, cash, debtor days and working capital at a glance, six ratio gauges, eight charts and a traffic light on every ratio – without building a single formula.

Price
£5
Who it’s for
Management Accounts & Reporting
Works with
Microsoft Excel for Windows and Mac
Buy now

See how it works

A walk through the main sheets

The sheets you will use most, in the order you will use them – shown with the sample data every workbook comes with.

Step 1

Ratios

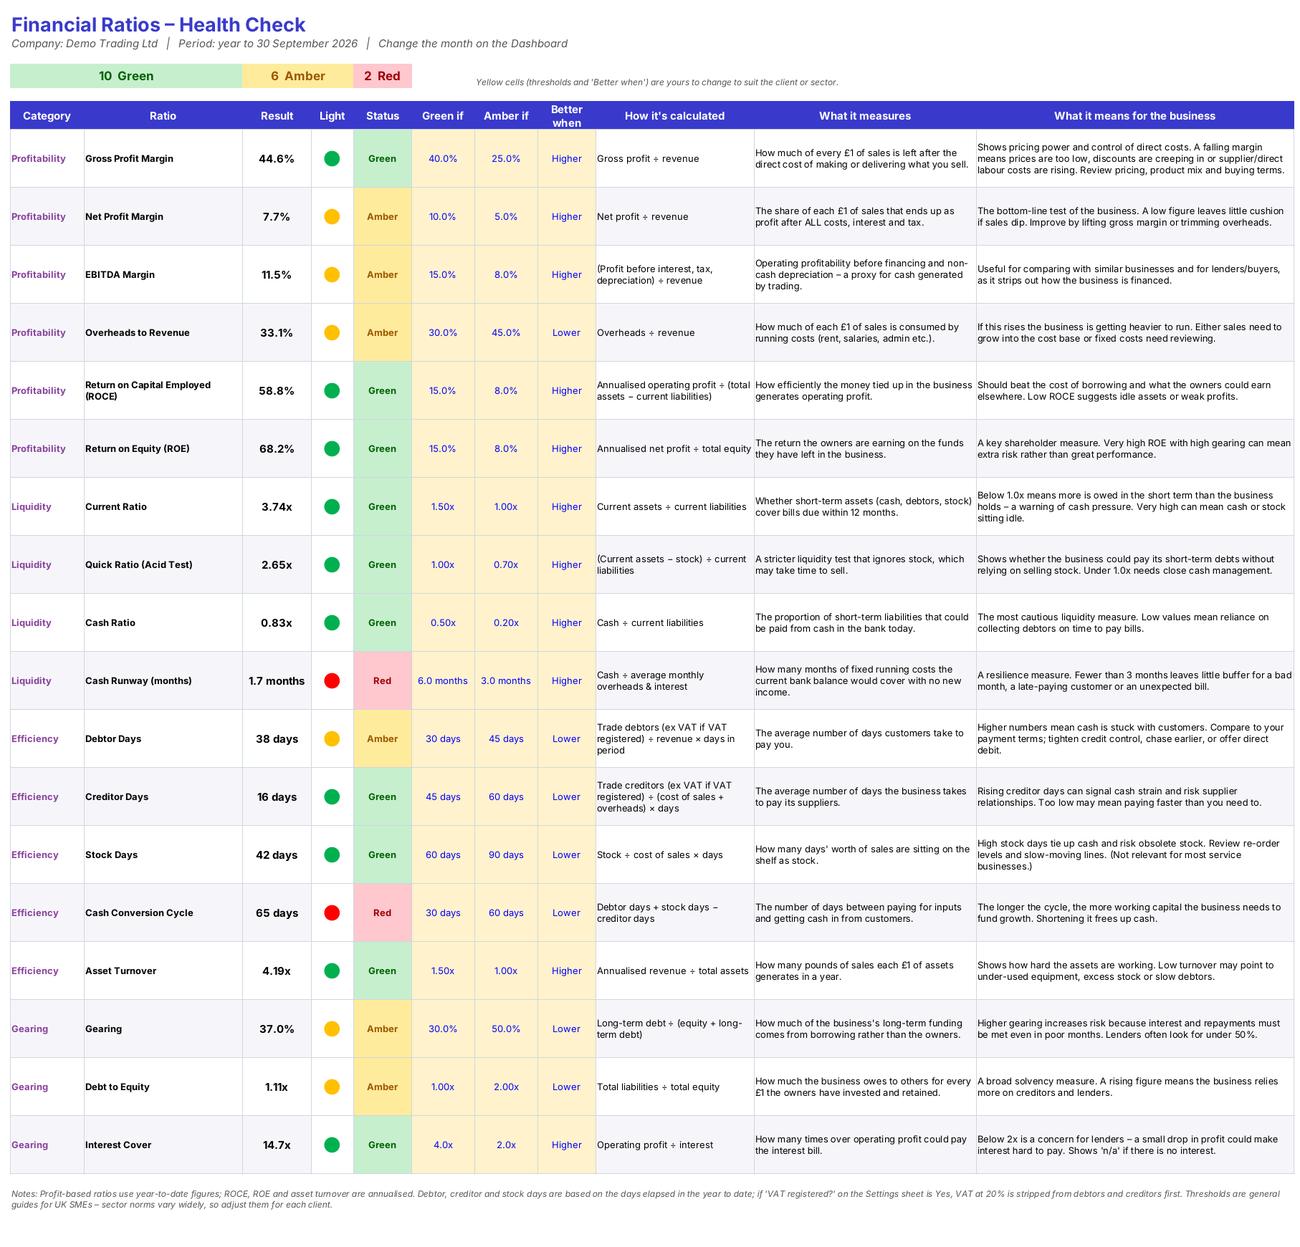
18 ratios with traffic lights and explanations. What you do: optionally adjust the yellow thresholds and 'Better when'.
Ratios
Transactions

Step 2

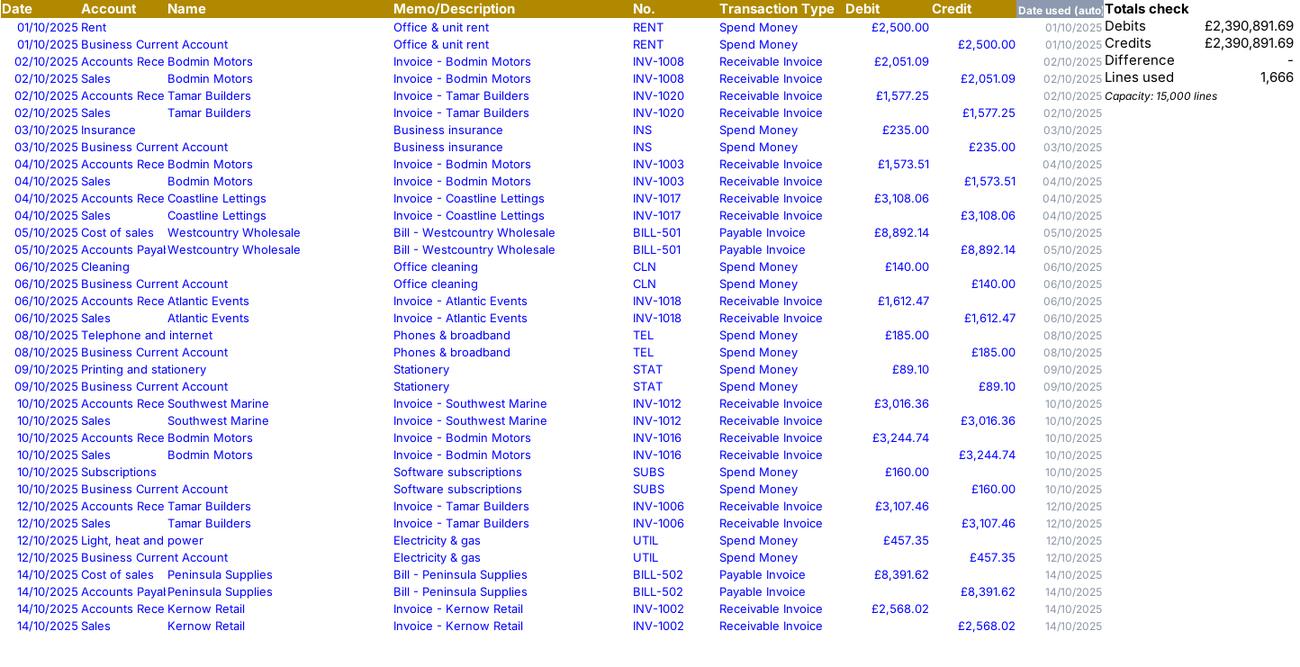
Transactions

QuickBooks transaction lines (gold header). What you do: paste the year's transactions.

Step 3

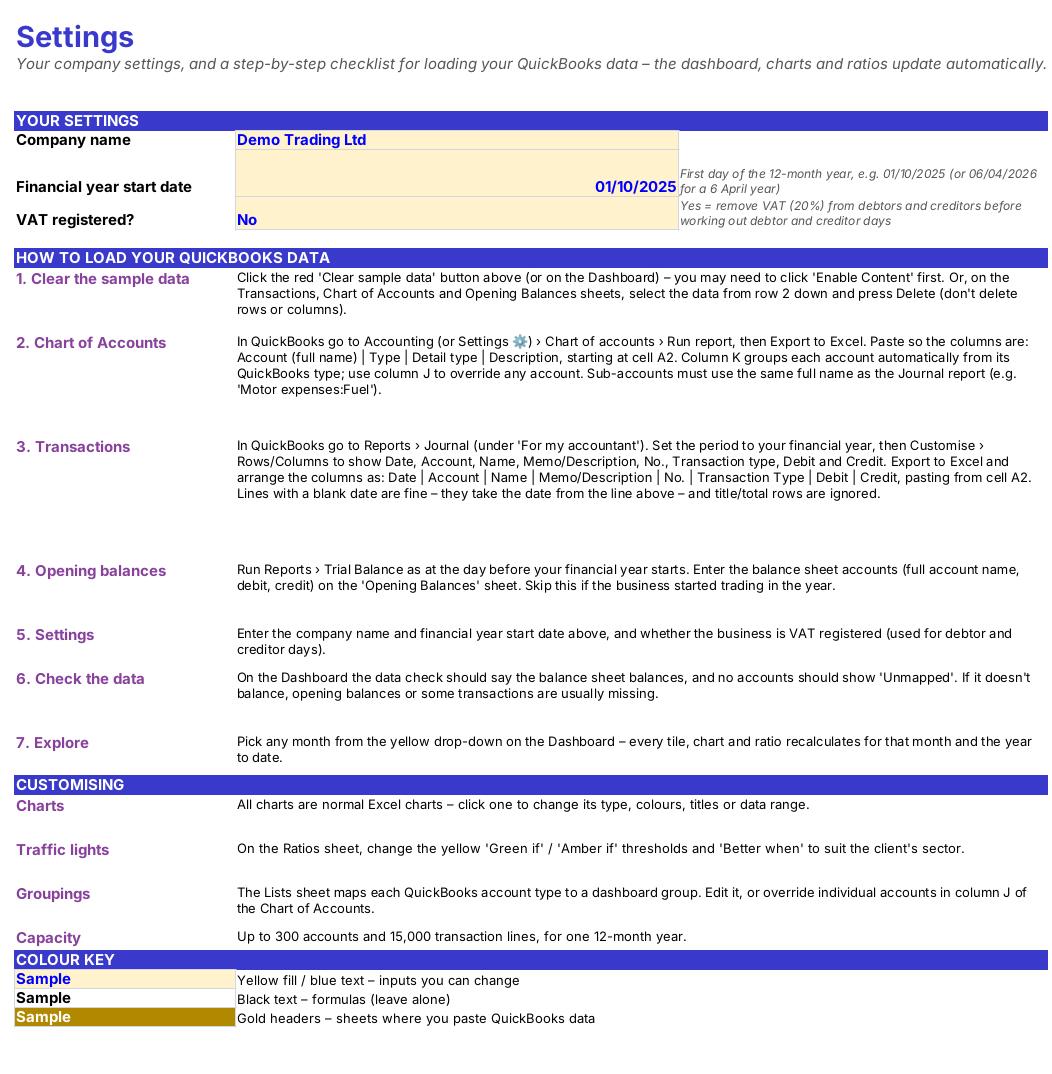
Settings

Your settings and a short loading checklist for QuickBooks data. What you do: enter company name and year start date.
Settings
Chart of Accounts

Step 4

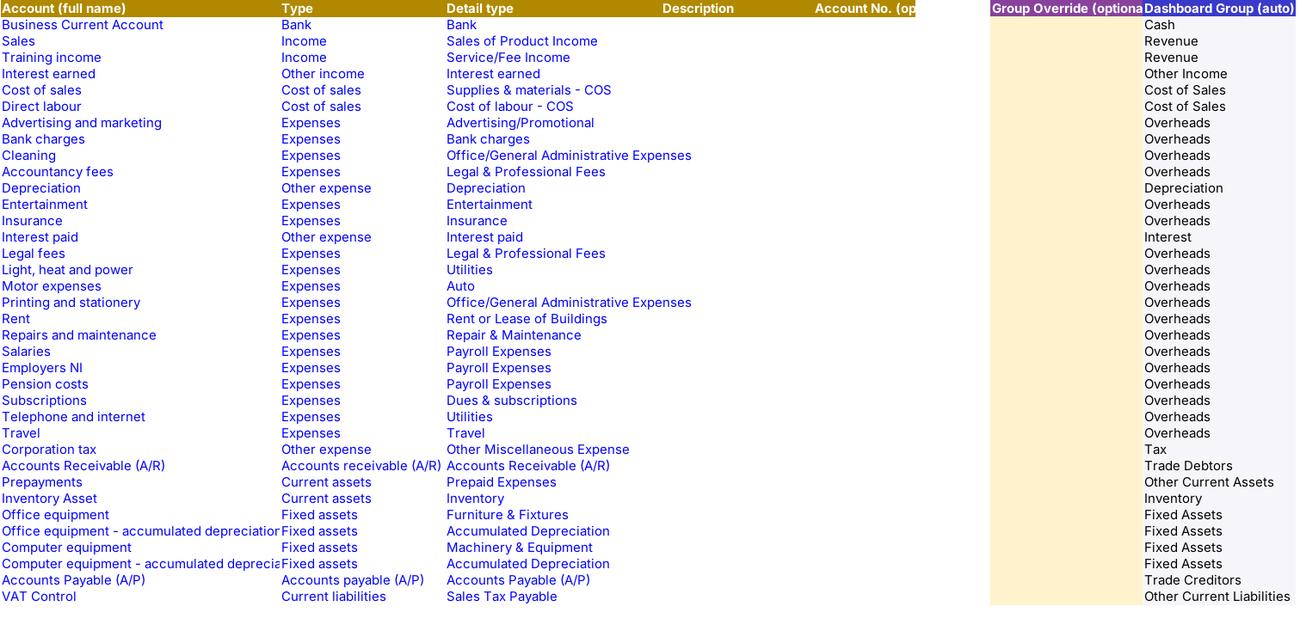
Chart of Accounts

QuickBooks accounts and their dashboard group (gold header). What you do: paste your chart; override groups in column J if needed.

Who it is for

Made for people like you

  • Example – text
  • Owner-managers and directors – A quick, visual monthly check on profit, cash and financial health.
  • Bookkeepers – A dashboard for clients straight from QuickBooks in minutes.
  • Accountants and advisers – A consistent ratio health check to start conversations with clients.
  • Anyone applying for finance – The ratios lenders look at, with plain-English explanations.
  • Your settings live on the Settings sheet – The company name, financial year start date and 'VAT registered?' are entered on the separate 'Settings' sheet (yellow cells C7, C8 and C9). This User Manual is for reading only.
  • Need more? – The QuickBooks Management Pack uses the same data and adds an executive summary, a profit and loss account against budget, a balance sheet, a cash flow statement, a 12-month trend and a printable cover and contents page.

Quick start

Up and running in minutes

  1. Example – text
  1. Look at the sample – The Dashboard opens with a full year of sample data for Demo Trading Ltd. Scroll down it and look at the Ratios sheet to see everything working.
  2. Clear the sample data – Click 'Clear sample data' on the Settings sheet or the Dashboard. It empties the Transactions, Chart of Accounts and Opening Balances sheets and resets the company name to 'Your Company Ltd' – formulas, charts and settings are kept.
  3. Enter your settings – On the Settings sheet type the company name (C7) and the first day of the financial year (C8) and whether the business is VAT registered (C9).
  4. Paste your QuickBooks chart of accounts – Into the 'Chart of Accounts' sheet – see the step-by-step section below. Check nothing shows 'Unmapped' in column K.
  5. Paste your QuickBooks transactions – Every transaction line for the year into the 'Transactions' sheet, in the eight-column layout described below.
  6. Enter opening balances – From the trial balance at the day before the year starts, on the 'Opening Balances' sheet.
  7. Pick the month and check – Choose the month in the yellow box on the Dashboard and make sure the data check says the balance sheet balances.
  8. Read the results – Start with the headline tiles and gauges, then the Ratios sheet for what each traffic light means.

Key features

  • Paste in your QuickBooks chart of accounts and transactions – everything else updates automatically.
  • Key figures, trend charts and an expense breakdown on one dashboard.
  • 18 financial ratios with plain-English explanations, gauges and traffic lights.
  • Pick any month of the financial year – every figure updates for that month and the year to date.

What’s included

  • Dashboard – Key figures and charts
  • Ratios – Ratios with traffic lights
  • Settings – Company settings and loading checklist
  • User Manual – Full user manual
  • Transactions – Paste your transactions
  • Chart of Accounts – Paste your accounts
  • Opening Balances – Opening balances

How buying works

Your file is only released once payment has cleared.

1

Click Buy now

You are taken to our secure checkout.

2

Pay securely

Checkout takes a minute and you get a receipt by email.

3

Download your file

Your download link arrives as soon as payment clears.

Explore the range

Need it tailored to your business?

We can adapt any prebuilt solution or build something bespoke, with a lifetime bug-free guarantee.

Part of AML Finance Group

Need an accountant too?

Our sister firm, AML Accountancy Solutions, is an award-winning accountancy practice helping businesses and individuals across the UK with their accounts, tax, bookkeeping and payroll.

Visit AML Accountancy Solutions