Turn your Sage data into an interactive dashboard and ratio report
Secure checkout. Your download link is sent as soon as payment clears.
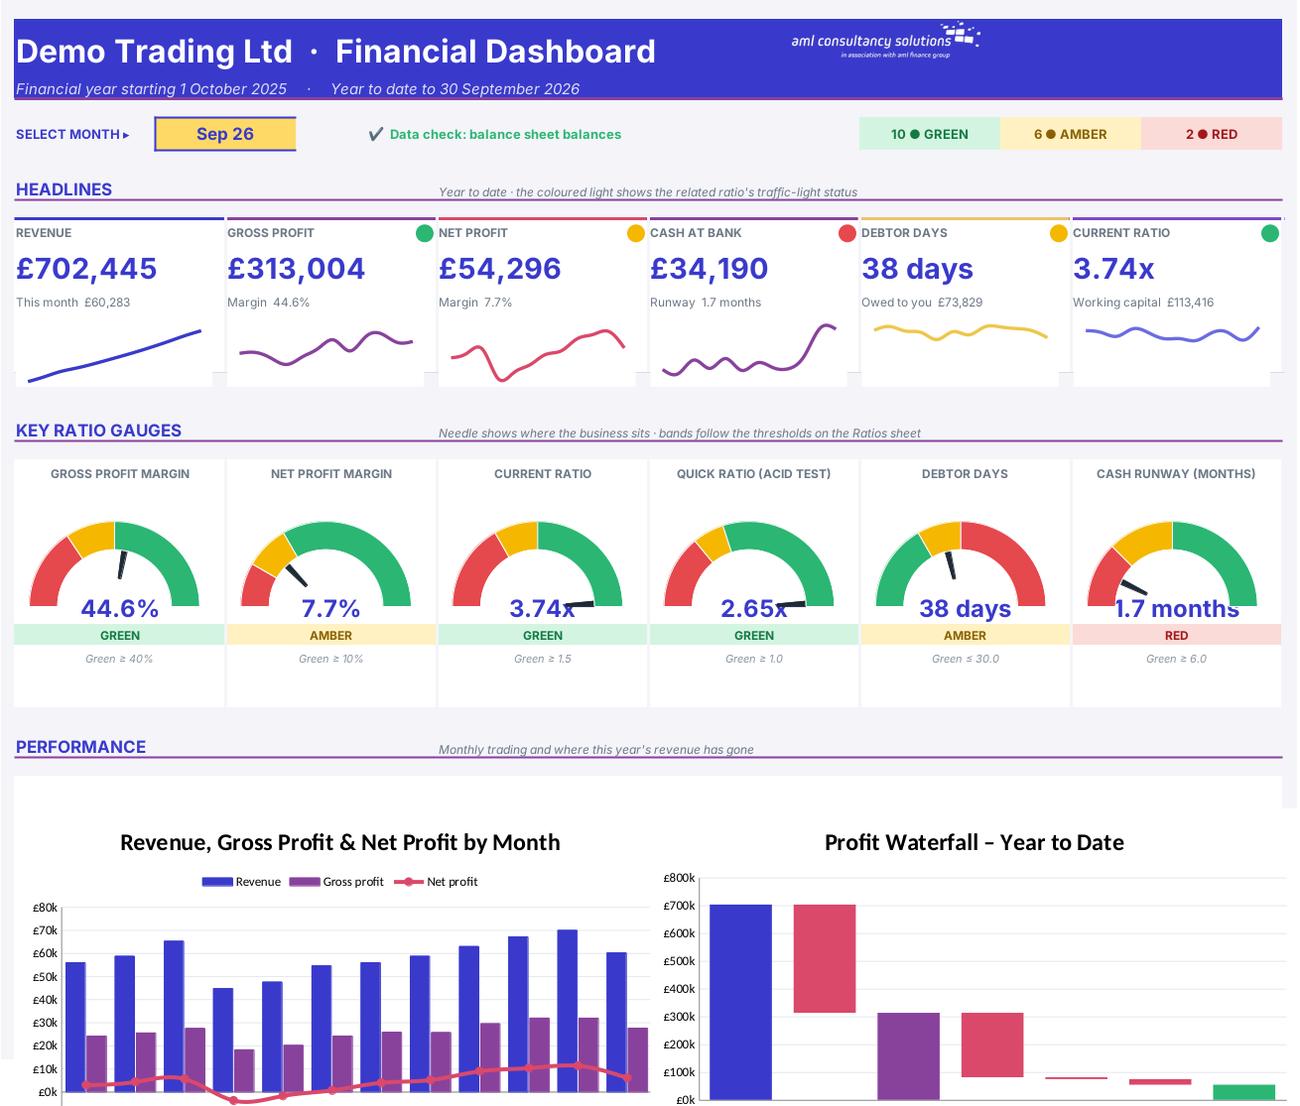
The Sage Dashboard – Lite turns a straight copy of your Sage chart of accounts and transactions into a one-page visual dashboard and an 18-ratio financial health check. Pick a month and you'll see revenue, profit, cash, debtor days and working capital at a glance, six ratio gauges, eight charts and a traffic light on every ratio – without building a single formula.
See how it works
The sheets you will use most, in the order you will use them – shown with the sample data every workbook comes with.
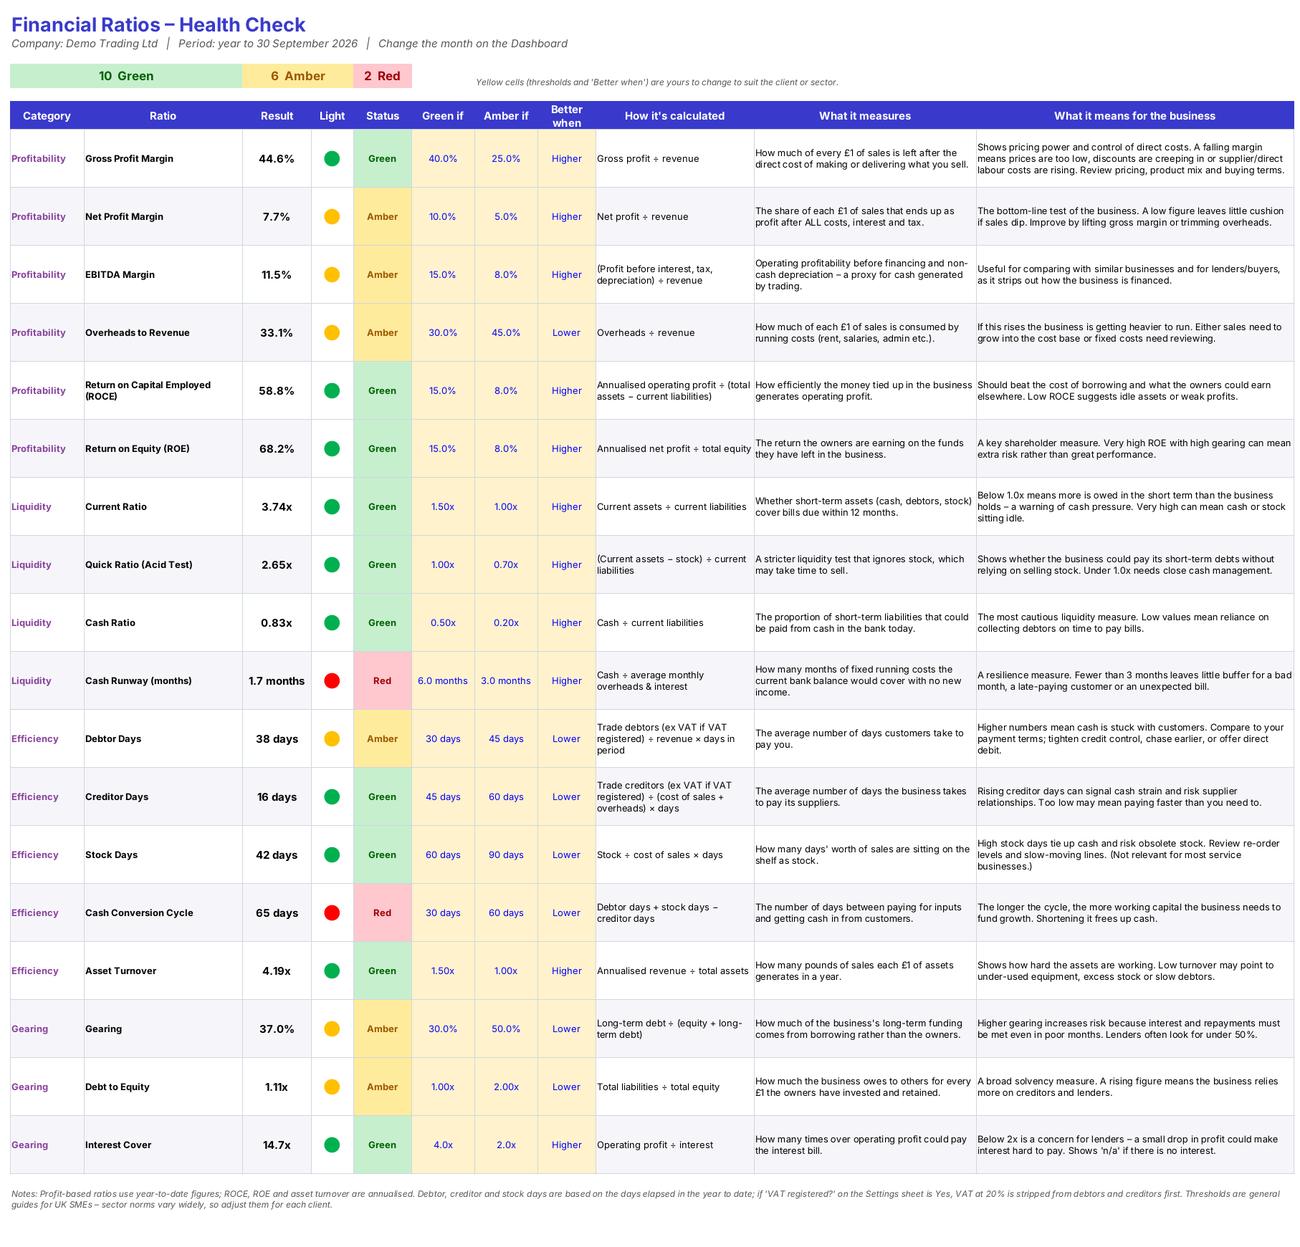
Step 1
18 ratios with traffic lights and explanations. What you do: optionally adjust the yellow thresholds and 'Better when'.
Step 2
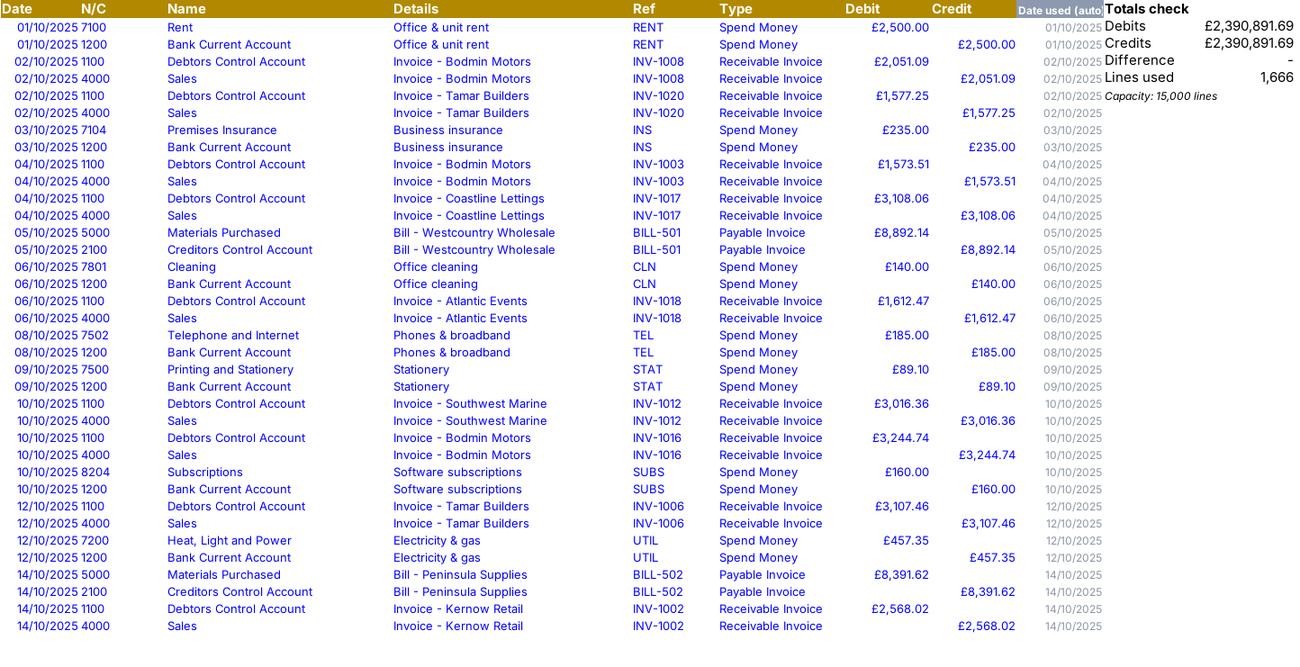
Sage transaction lines (gold header). What you do: paste the year's transactions.
Step 3
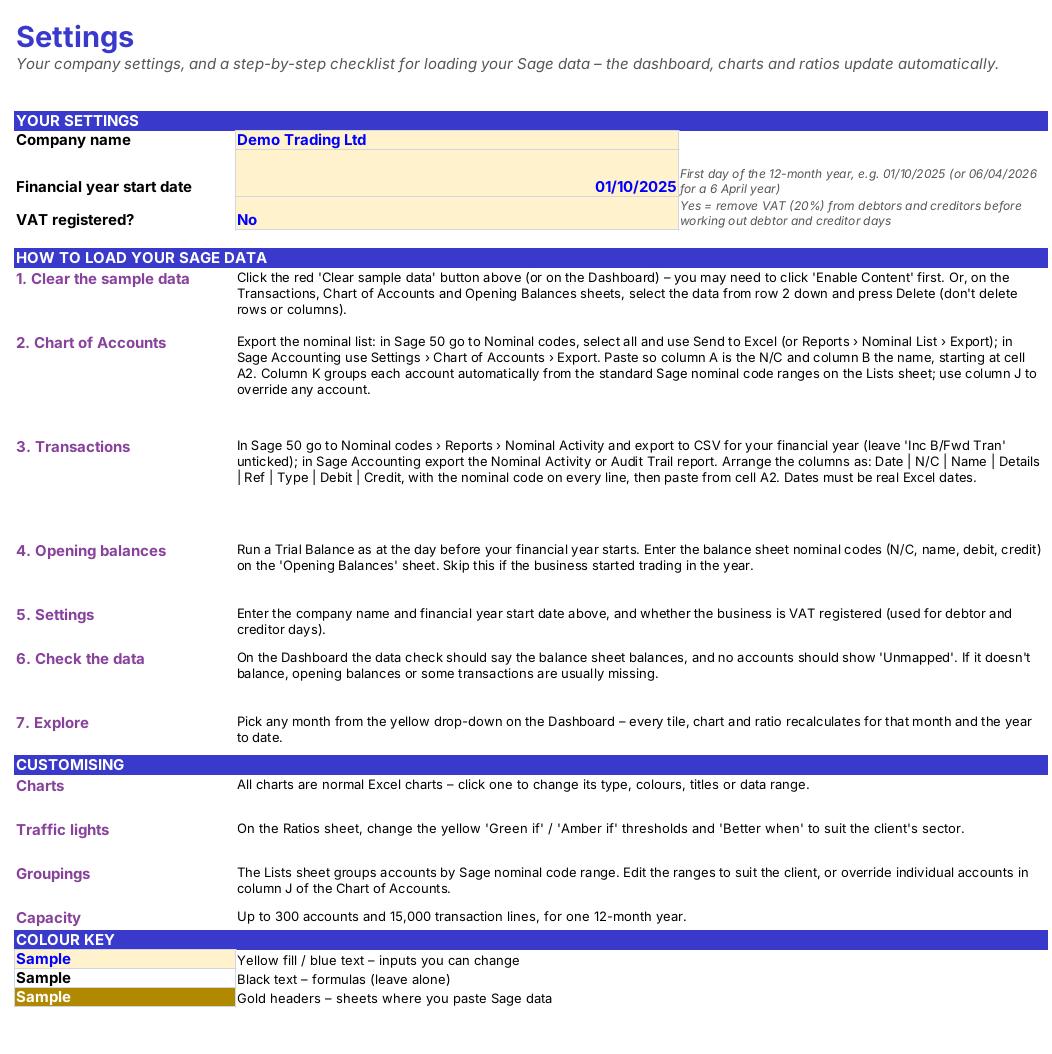
Your settings and a short loading checklist for Sage data. What you do: enter company name and year start date.
Step 4
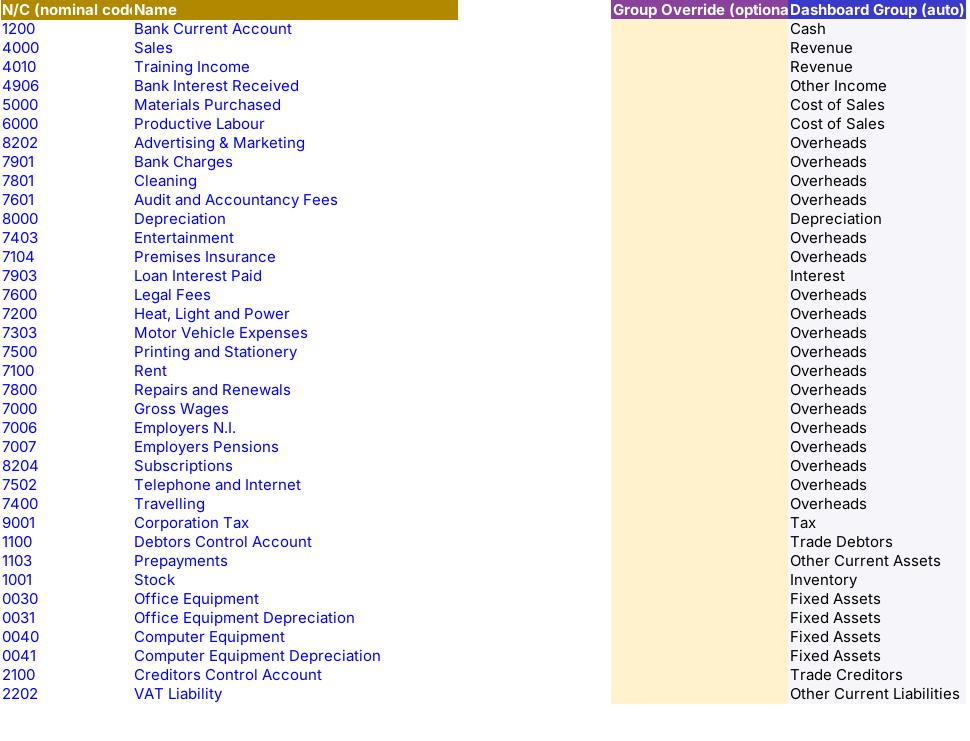
Sage accounts and their dashboard group (gold header). What you do: paste your chart; override groups in column J if needed.
Who it is for
Quick start
Your file is only released once payment has cleared.
You are taken to our secure checkout.
Checkout takes a minute and you get a receipt by email.
Your download link arrives as soon as payment clears.
We can adapt any prebuilt solution or build something bespoke, with a lifetime bug-free guarantee.
Part of AML Finance Group
Our sister firm, AML Accountancy Solutions, is an award-winning accountancy practice helping businesses and individuals across the UK with their accounts, tax, bookkeeping and payroll.
Visit AML Accountancy Solutions